Projects

Systems built for clients, products and projects, each titled by the business result it delivers.

Worked with

Selected work

Client work

Null Labs AI Inc., United States · Argus

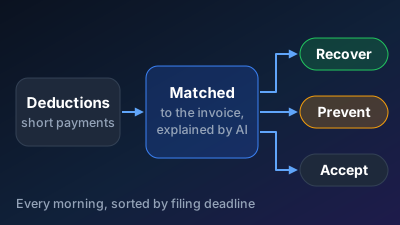
Every retailer deduction matched, explained and ready to dispute

Suppliers lose money to deductions taken out of their Walmart payments, and most can't tell which ones are wrong before the dispute window closes.

  • Every deduction matched to its invoice and classified every morning, with no manual digging.
  • Disputes filed inside the window, drafted with their evidence and approved by a person.
  • Repeat causes visible by distribution center, item and carrier, so they get fixed upstream.
Get this for your business
Client work

Waha Bosch Auto Service · Bosch Car Service center

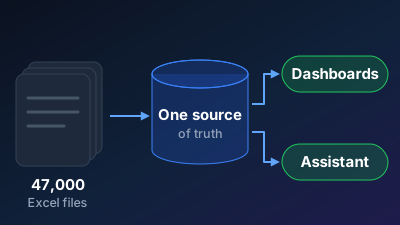
47,000 workshop Excel files turned into one source of truth and an AI assistant

A three-branch car-service business ran on about 47,000 Excel files, with the same customer, car or part written many ways and transfer receipts arriving as phone screenshots.

  • About 47,000 scattered files turned into one source of truth.
  • The same customer, car or part recognised across every spelling.
  • Branch performance on Power BI dashboards, and an assistant that answers from the data and price lists.
Get this for your business
Ready to set up

Project · Daily cash dashboard

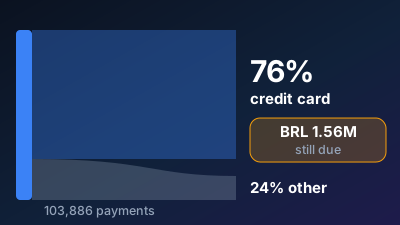
Knowing where 76% of the money comes from, every day

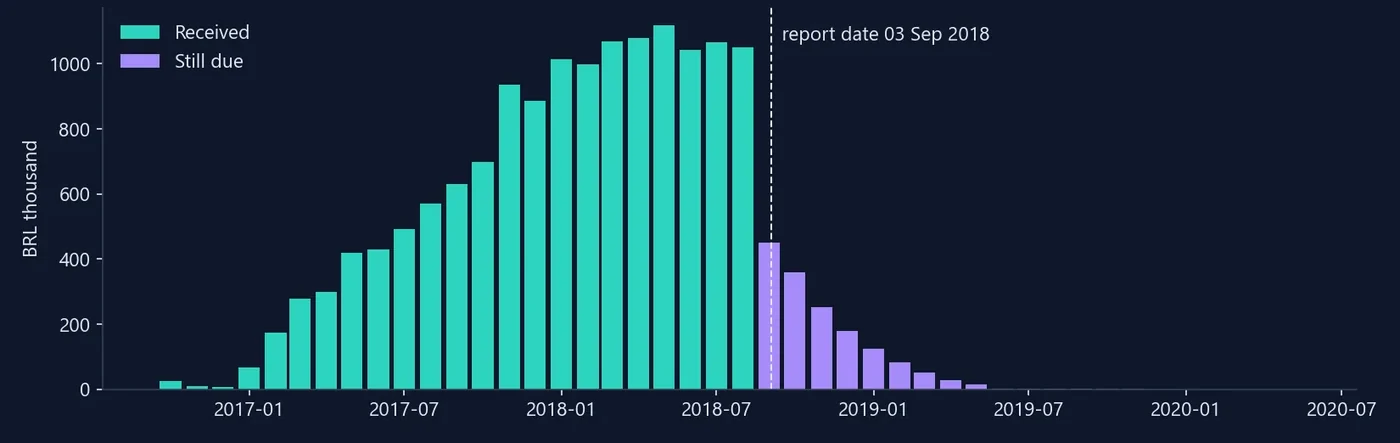
103,886 payments 76% of the cash in arrived by credit card, and BRL 1.56 million was still due on instalments.

  • Today's cash on one page, not at month end.
  • Instalments still due and late payments listed.
  • The payment methods and regions that bring the money in.
Get this for your business
Ready to set up

Project · Egypt real estate price tracker

Our asking price per m² against 5,619 competing listings, every week

A developer or brokerage selling units in Egypt's growth areas checks competing listings by hand now and then, so nobody can say how its asking price per m² compares with the units around it, or who cut their price.

  • Our asking price per m² set against the market every week, area by area.
  • The areas and units where we ask most above the median of their type.
  • Every price kept with its week, so a competitor's cut shows up the week it happens.
Get this for your business

Projects

Null Labs AI Inc., United States · Argus

Every retailer deduction matched, explained and ready to dispute

The problem

Suppliers lose money to deductions taken out of their Walmart payments, and most can't tell which ones are wrong before the dispute window closes.

The solution

Argus runs the supplier's Walmart account on one screen. It collects every invoice, payment and deduction daily, matches each one to the cent, explains it, and drafts the dispute when it is worth fighting.

How it works

  • Collect: Invoice, payment and dispute records from Walmart's supplier API and portals, every day
  • Store: A PostgreSQL warehouse with raw, cleaned and reporting layers
  • Match: Every short payment matched to its invoice, to the cent
  • Classify: A rules knowledge base maps each deduction by code and root cause, and says whether it is worth disputing
  • Draft: LLM agents draft each dispute with its evidence, and a RAG assistant answers why any deduction happened, quoting Walmart's rules and the contract
  • Decide: Dashboards show what to recover, prevent or accept, sorted by filing deadline, and the team approves every filing

The impact

  • Every deduction matched to its invoice and classified every morning, with no manual digging.
  • Disputes filed inside the window, drafted with their evidence and approved by a person.
  • Repeat causes visible by distribution center, item and carrier, so they get fixed upstream.
  • One working list for the team: recover, prevent or accept, sorted by deadline.

Built with

  • Python
  • PostgreSQL
  • Airflow
  • Playwright
  • LLM agents
  • RAG
  • Streamlit

Waha Bosch Auto Service · Bosch Car Service center

47,000 workshop Excel files turned into one source of truth and an AI assistant

The problem

A three-branch car-service business ran on about 47,000 Excel files, with the same customer, car or part written many ways and transfer receipts arriving as phone screenshots.

The solution

One pipeline reads every invoice and daily sheet, cleans the names and loads a warehouse that refreshes itself, with dashboards and an assistant on top.

How it works

  • Read: About 47,000 Excel files: form-style invoices and daily cash workbooks
  • Clean: Customer, car and part names standardised across every spelling
  • Load: A warehouse that refreshes itself every day
  • Answer: An assistant that answers from that data and the price lists
  • Report: Power BI dashboards and improved Excel templates

The impact

  • About 47,000 scattered files turned into one source of truth.
  • The same customer, car or part recognised across every spelling.
  • Branch performance on Power BI dashboards, and an assistant that answers from the data and price lists.
  • Improved Excel templates, so new data arrives clean.

Built with

  • Python
  • PostgreSQL
  • Airflow
  • RAG
  • LLM agents
  • Power BI
  • Excel

Project · HR attrition dashboard

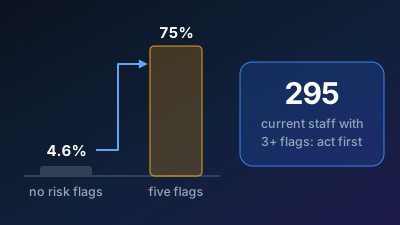
An early-warning list of the 295 employees most at risk of leaving

The problem

An HR team sees one in six employees leave but cannot tell where it happens, why, or who will go next, so retention money gets spread across everyone.

The solution

A Power BI report on a clean star schema that shows where people leave, the drivers behind it and a risk score for every employee, ending in five actions, each with a KPI and an owner.

How it works

  • Clean: The HR table, 1,470 employees and 35 columns, cleaned in one Power Query staging step
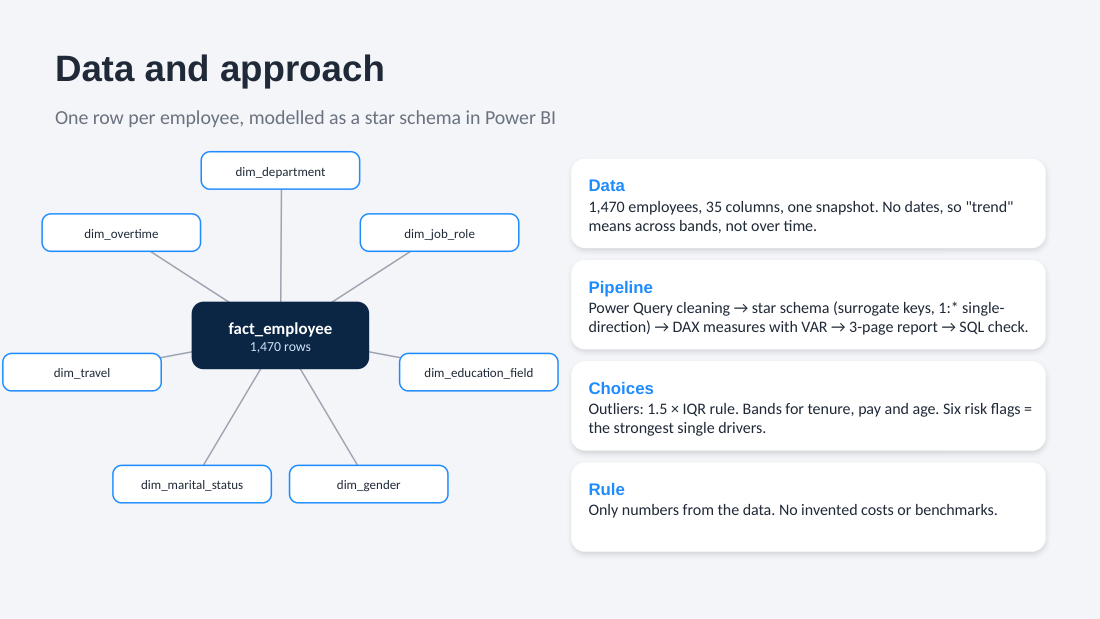
  • Model: A star schema: one employee fact table and seven dimensions, every filter one way
  • Measure: 15 DAX measures with variables, and outliers found with the 1.5 × IQR rule
  • Score: Six risk flags per employee: overtime, single, entry level, no stock options, two years or less, low satisfaction
  • Show: A home page and three report pages: overview, drivers, trends and outliers
  • Act: Five actions, each with a KPI and an owner, and the list of people to talk to first

A closer look

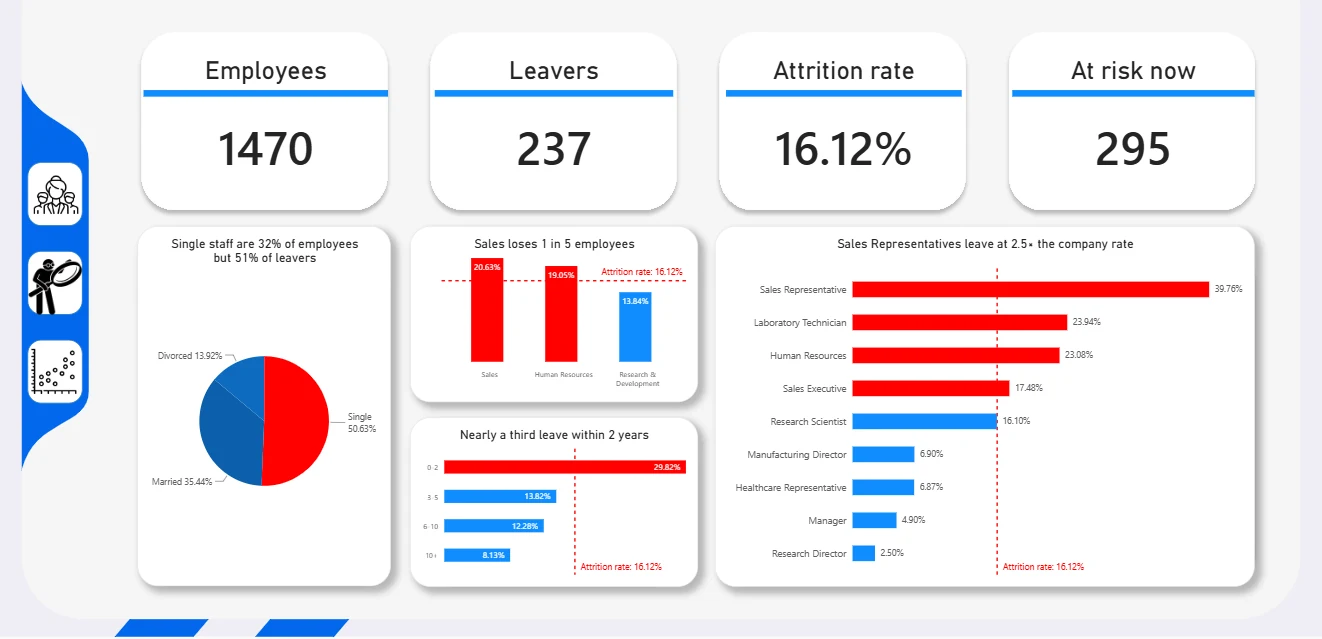
Power BI Overview page: 1,470 employees, 237 leavers, a 16.12% attrition rate and 295 at risk now, with attrition by marital status, department, tenure and job role.
The Overview page in Power BI.
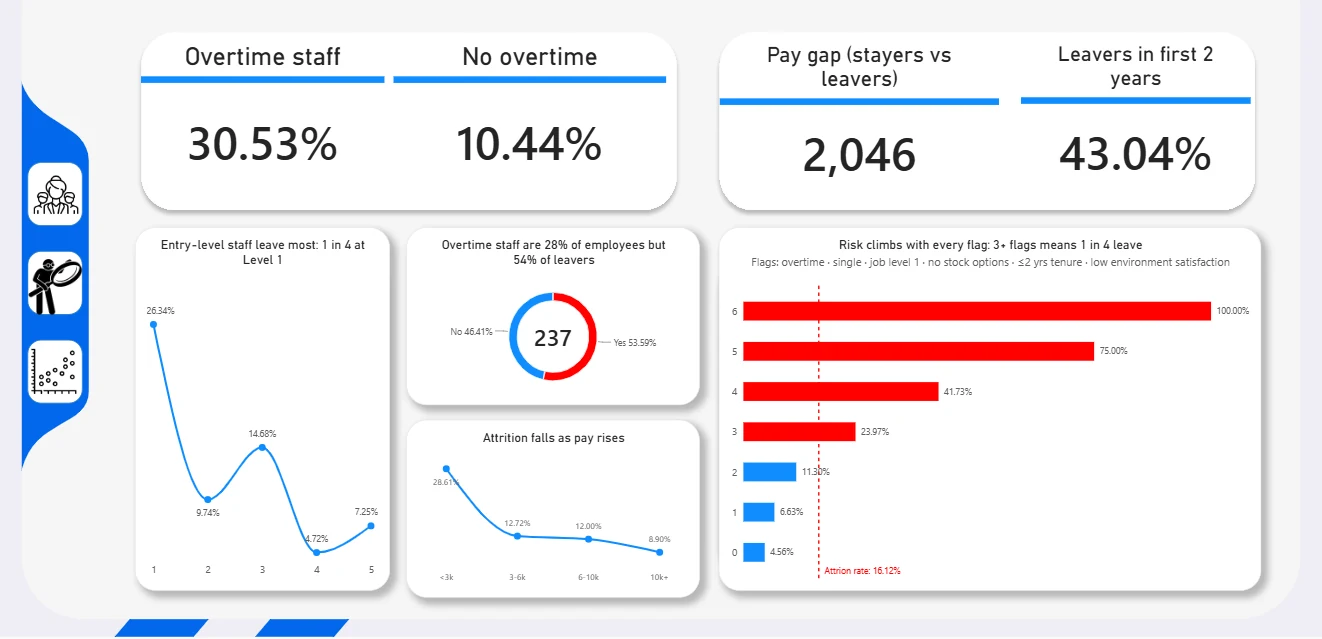
Power BI Drivers page: 30.53% attrition with overtime against 10.44% without, a 2,046 monthly pay gap between stayers and leavers, 43.04% of leavers in their first two years, and attrition rising with each risk flag.
The Drivers page in Power BI.
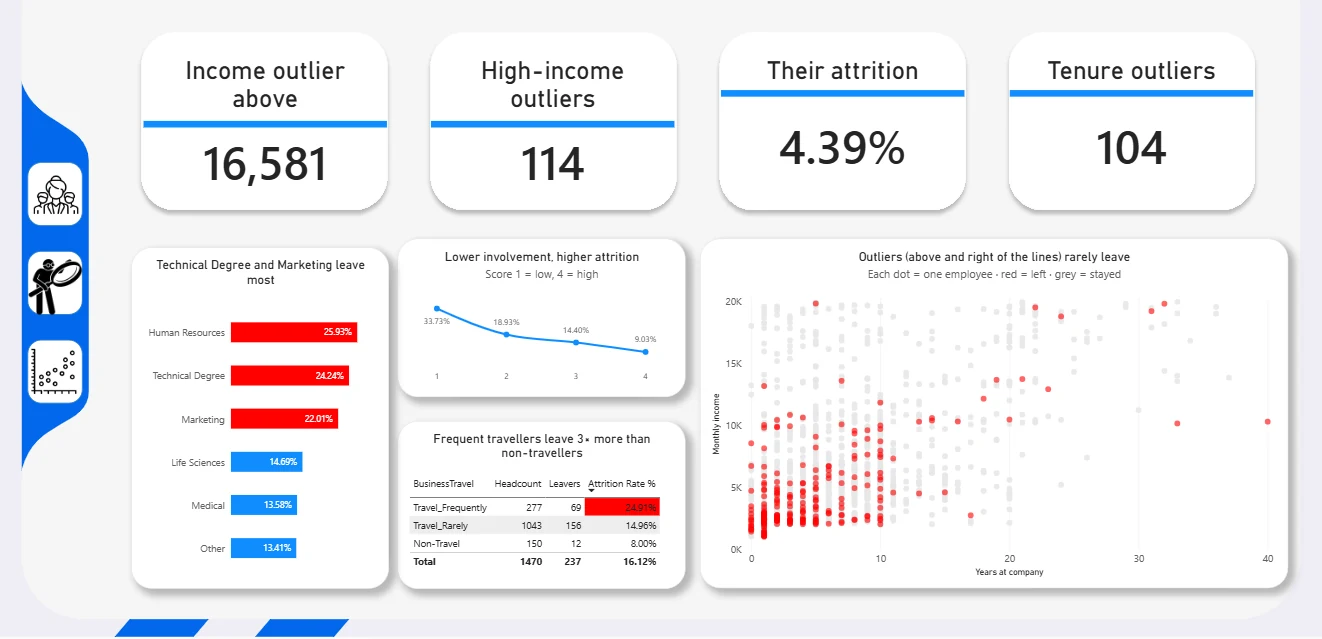
Power BI Trends and Outliers page: 114 high-income outliers above 16,581 a month with 4.39% attrition, 104 tenure outliers, attrition by education field, involvement and travel, and income plotted against years at the company.
The Trends and Outliers page in Power BI.
Star schema of the HR model: one employee fact table linked to seven dimensions such as department, job role and overtime.
The data model: one fact table, seven dimensions.
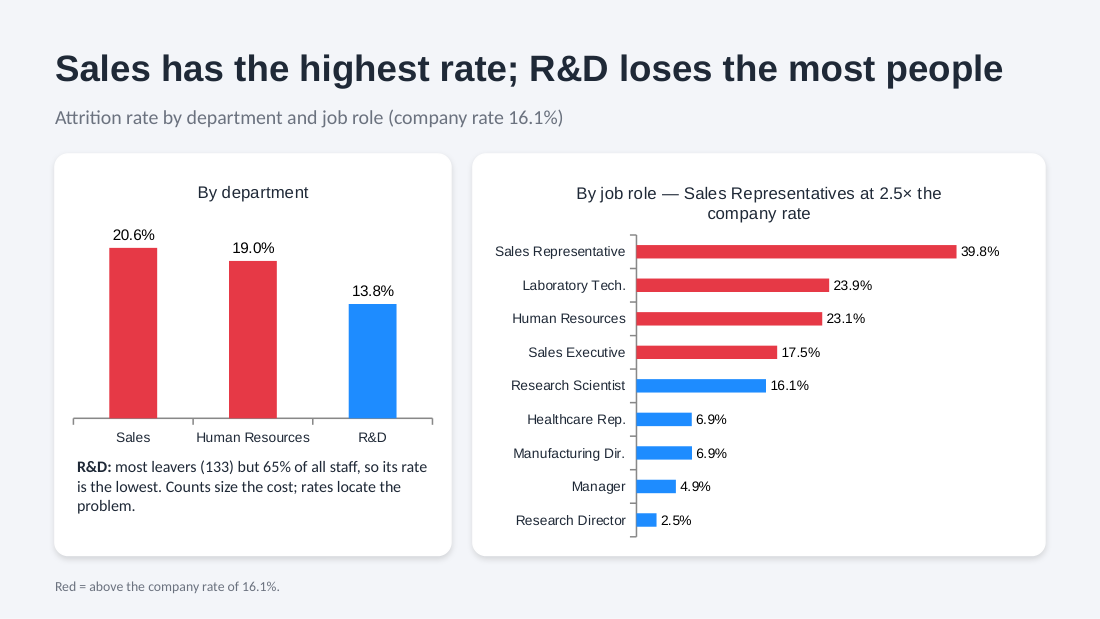
Attrition rate by department and by job role, with the roles above the company rate in red.
Where people leave.
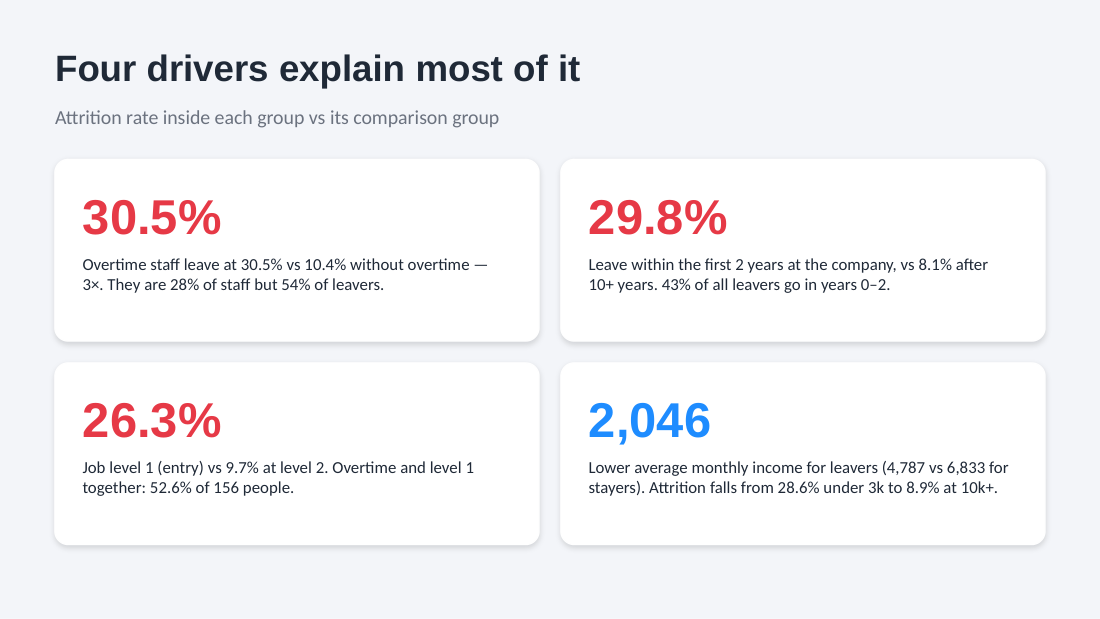
Four drivers of attrition: overtime, the first years at the company, entry job level and lower pay, each with its attrition rate.
The drivers behind it.

The code

Risk Flags =
VAR _OverTime = RELATED ( dim_overtime[OverTime] ) = "Yes"
VAR _Single = RELATED ( dim_marital_status[MaritalStatus] ) = "Single"
VAR _EntryLevel = fact_employee[JobLevel] = 1
VAR _NoStock = fact_employee[StockOptionLevel] = 0
VAR _EarlyTenure = fact_employee[YearsAtCompany] <= 2
VAR _LowEnvSat = fact_employee[EnvironmentSatisfaction] = 1
dax/measures.dax

The impact

  • Where: Sales has the highest rate, and Sales Representatives leave at 39.8%.
  • Why: overtime staff leave at 30.5% against 10.4%, and the first two years hold 43% of leavers.
  • Who next: 295 current employees carry three or more of the six risk flags.
  • What to do: five actions, each with a KPI to track on the dashboard and an owner.

The result

1,470 employee records: attrition climbs from 4.6% with no risk flags to 75% with five, and 295 current staff carry three or more.

Built with

  • Power BI
  • DAX
  • Power Query
  • Star schema
  • SQL

Product · job-radar, open source

Every new data and AI job from 22 sources, ranked and emailed every day

The problem

Finding data and AI work in Egypt and the Gulf means checking a dozen job boards and hundreds of career pages by hand, seeing the same job three times and still missing the new ones.

The solution

A pipeline that reads every source once a day, keeps each job once, ranks it against the roles, places and skills wanted, and emails only the jobs not seen before.

How it works

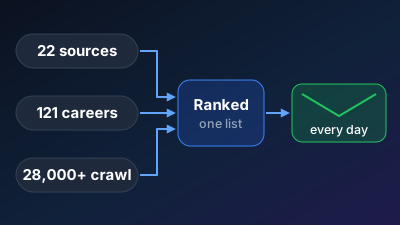
  • Collect: 19 job boards and job APIs in Egypt, the Gulf and remote, 121 company career pages in Egypt, a crawl of 28,000+ more and the Gmail job alerts
  • Respect: Every site read inside its limits: one that asks to wait is left alone for as long as it asks
  • Store: A PostgreSQL warehouse with raw, core and mart layers, where the same job on three boards is one row
  • Rank: Each job checked against the roles, places and level wanted, then scored by skills
  • Email: Two emails a day, Egypt and outside Egypt, junior to senior, each job sent once
  • Apply: On request, Claude grades the best matches, tailors the CV and applies only after a yes

A closer look

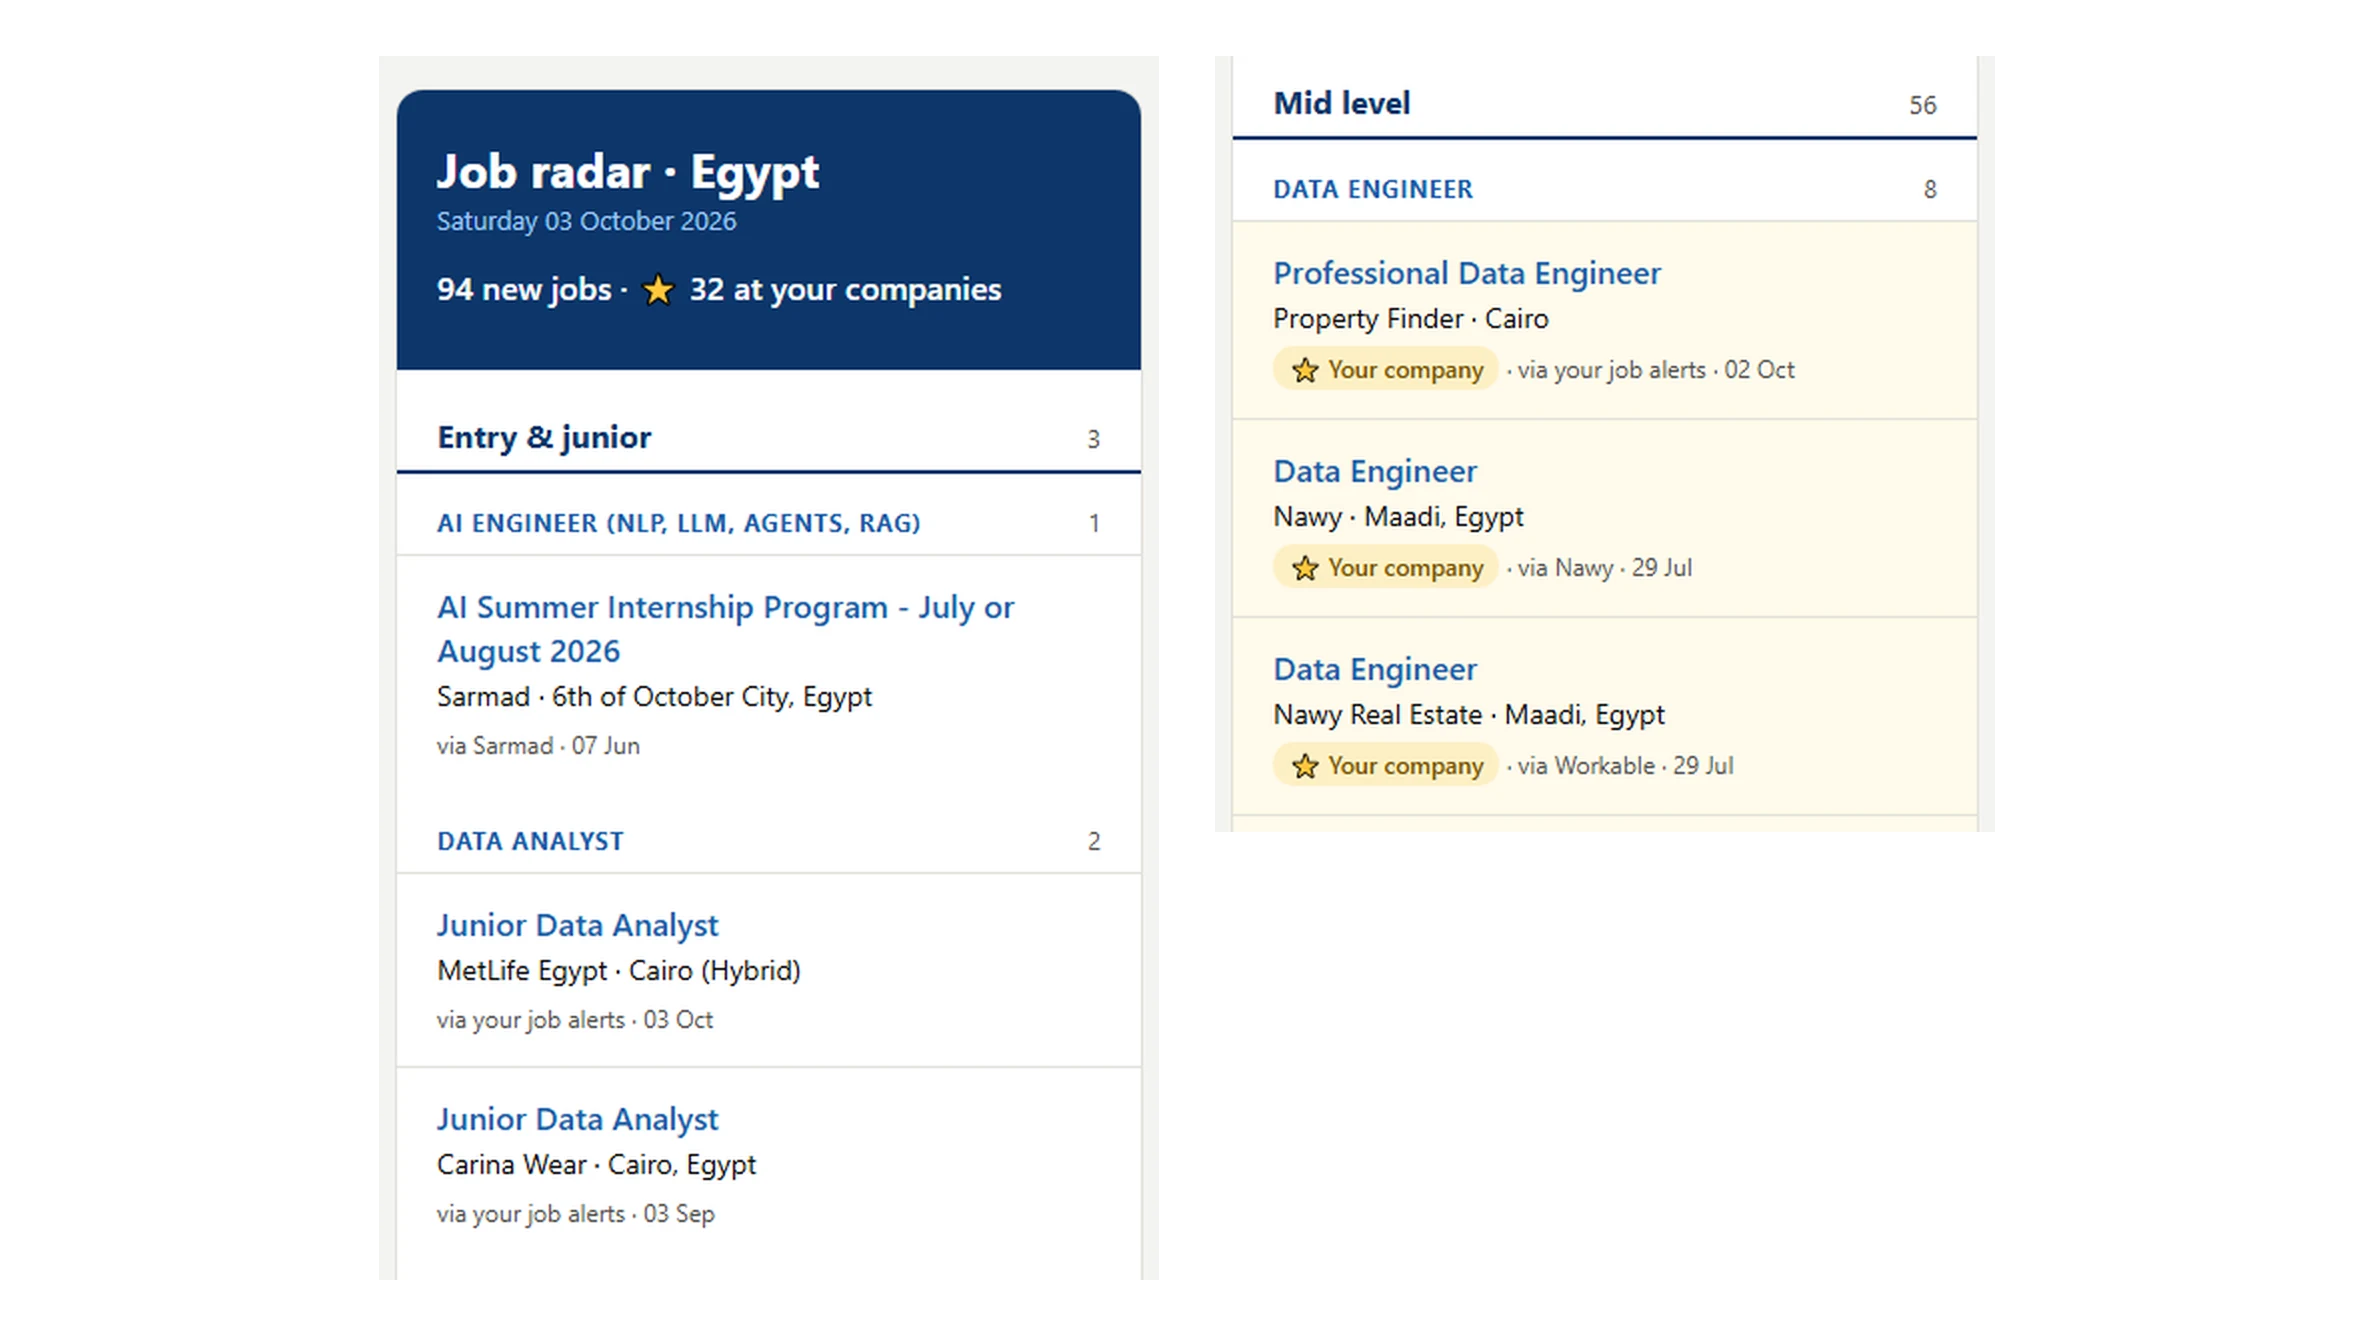
Daily job email for Saturday 3 October 2026: 94 new jobs, 32 of them at the watched companies, grouped by level and role, with 3 entry and junior jobs and 56 mid-level jobs.
The daily email.
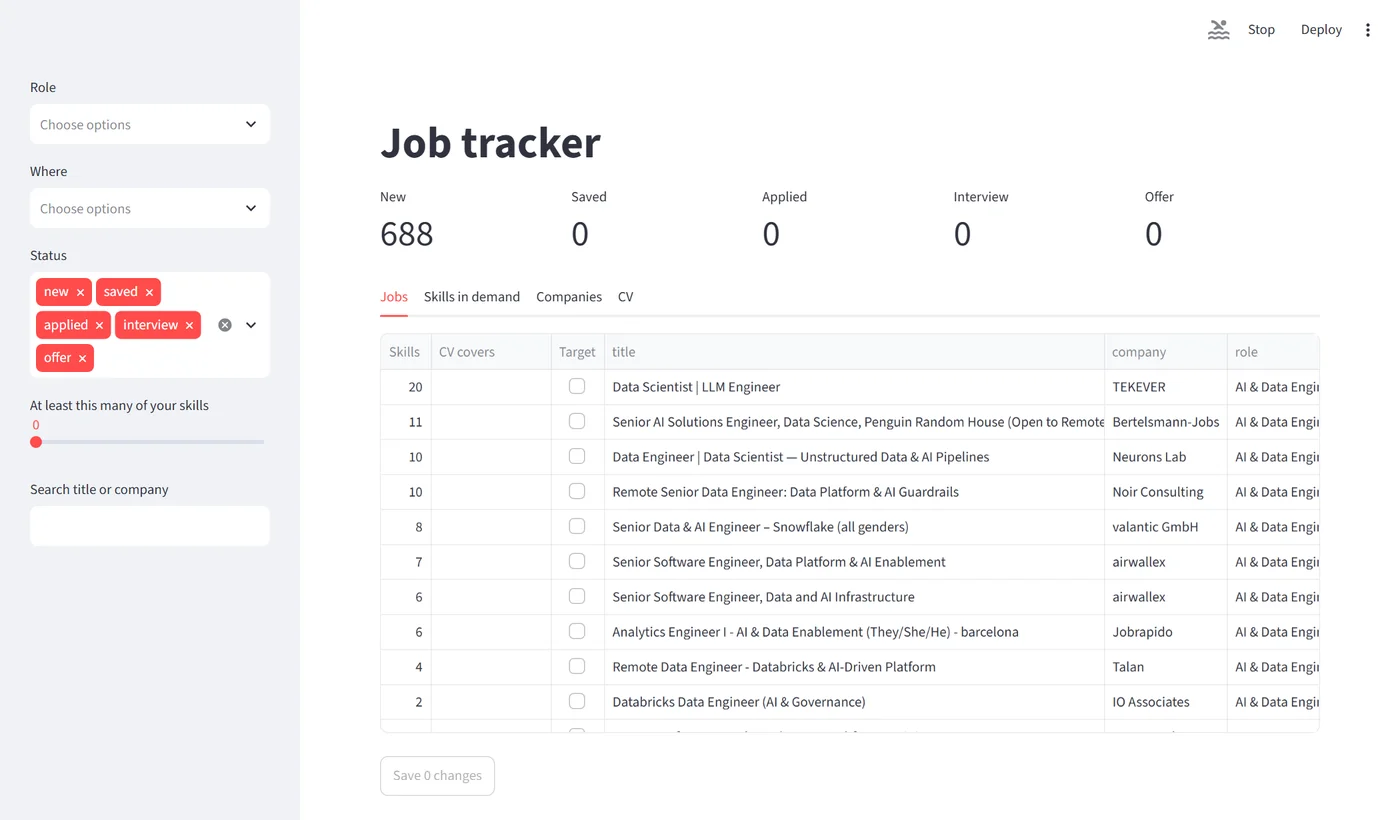
Job tracker app: 688 new jobs and 0 saved, applied, interview or offer, with filters for role, place and status and a table of jobs ranked by matching skills, the top one with 20.
The job tracker.
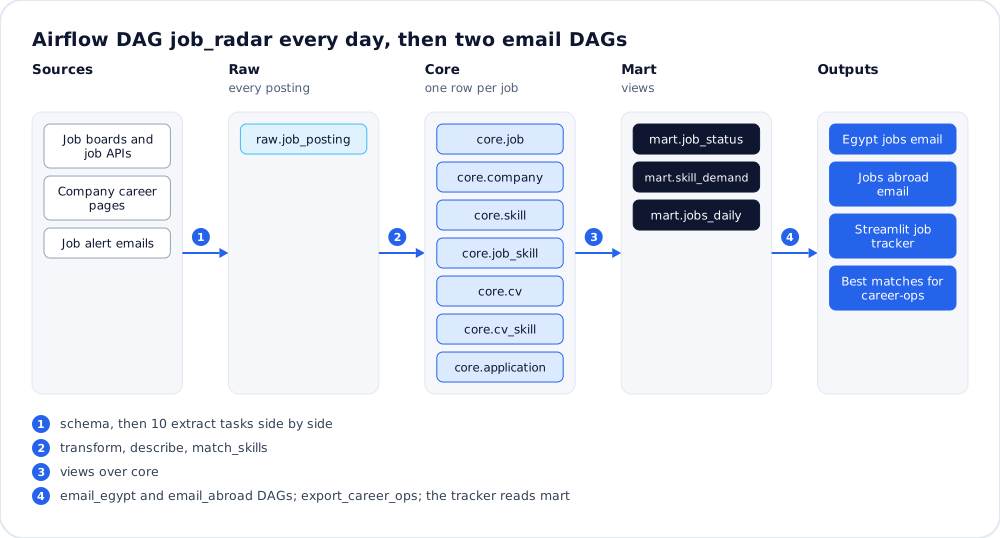
Pipeline diagram: job boards, company career pages and job alert emails flow through raw, core and mart layers to two daily emails, a job tracker and a list of the best matches.
The daily pipeline, from the job sources to the emails.
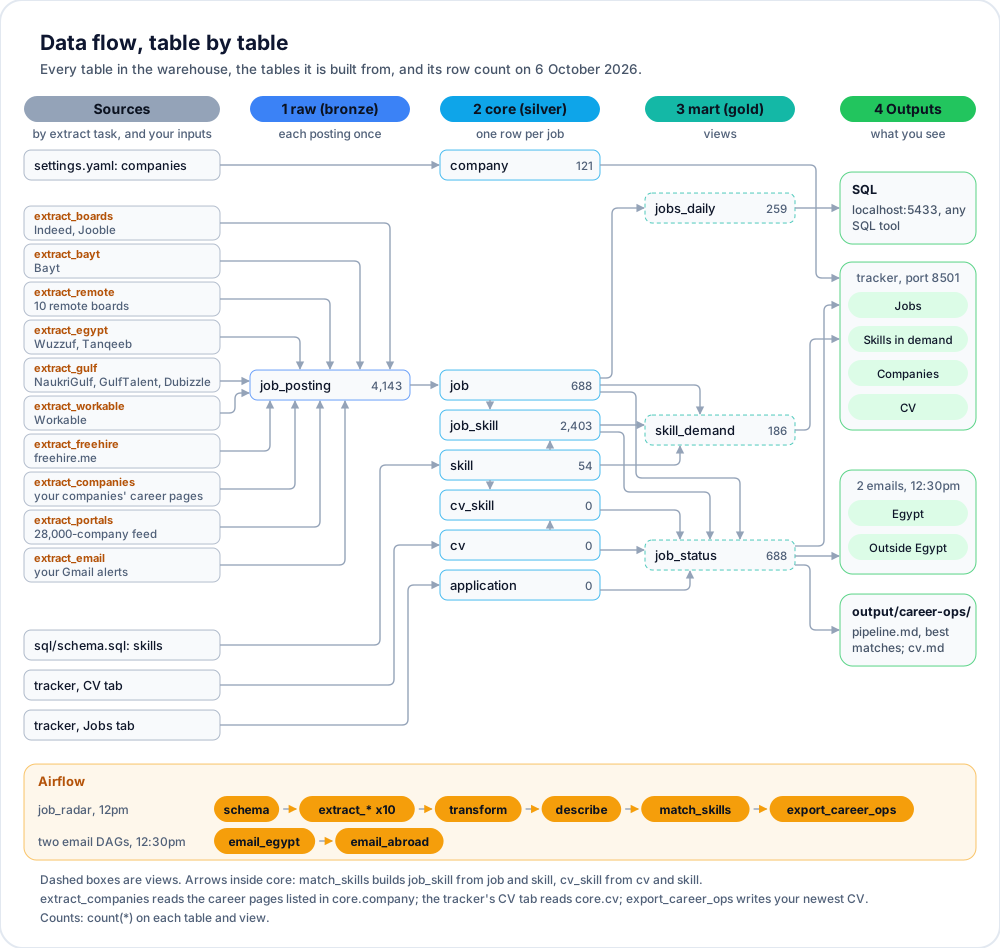
Data flow diagram: ten extract tasks fill 4,143 raw postings, folded into 688 jobs from 121 companies with 2,403 job skills across 54 skills, feeding the tracker, two daily emails and a best-matches list.
Every table, with its row count.
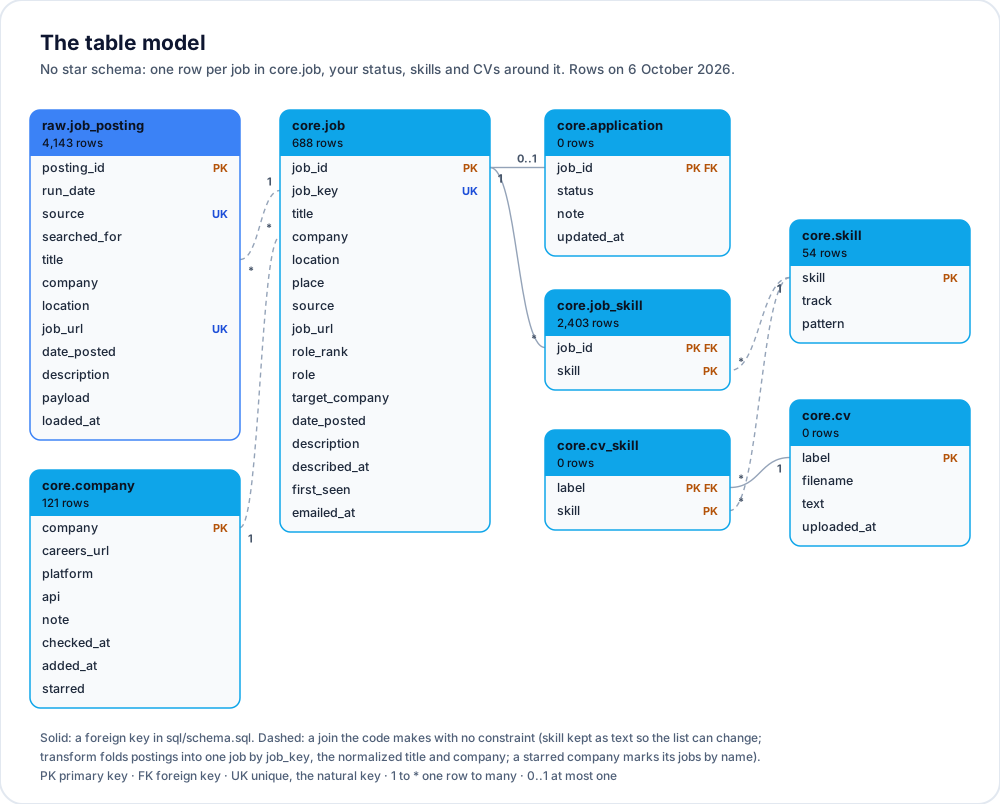
Table model: 4,143 raw postings fold into 688 jobs, each linked to its skills (2,403 rows across 54 skills), its status and 121 companies.
One row per job, with its skills and status.
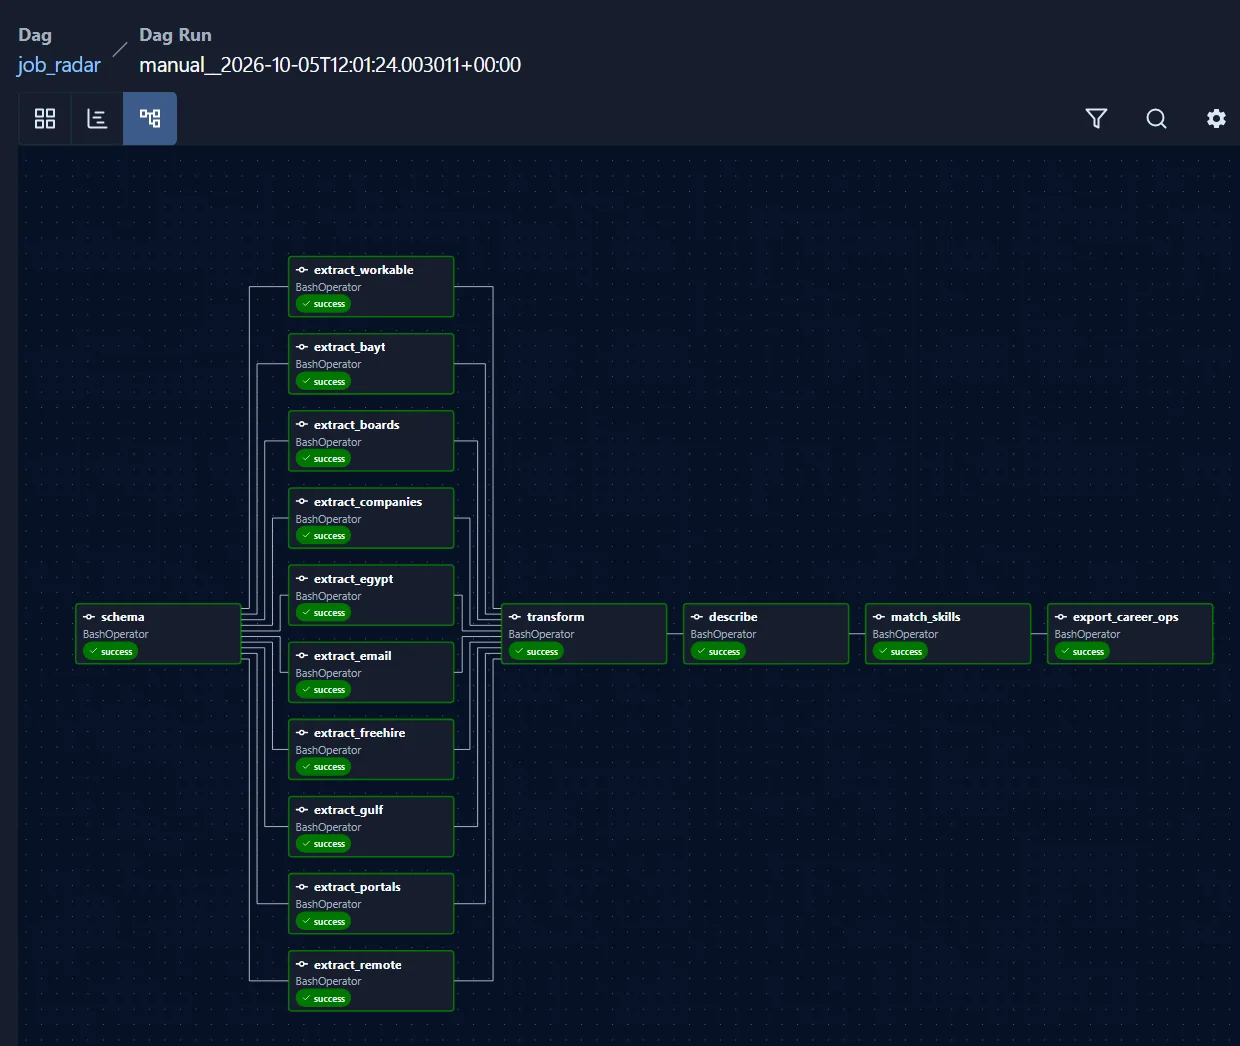
Airflow graph view of a successful run: schema, then ten extract tasks side by side, then transform, describe, match_skills and export_career_ops.
The Airflow DAG, run every day.

The code

- name: AI & Data Engineer
  search: [AI Data Engineer, Data AI Engineer, ML Data Engineer]
  title_needs:
    - [data]
    - [ai, ml, genai, llm, llms, machine learning]
    - [engineer*, developer*]

- name: Data Engineer
settings.yaml

The impact

  • A dozen boards and hundreds of career pages checked without opening one of them.
  • The same job on three boards, or reposted, arrives once.
  • Onsite jobs only where the commute works; everywhere else, remote only.
  • Roles, places and companies changed in plain words in one settings file.

The result

Open-source product: 22 sources, 121 company career pages in Egypt and a crawl of 28,000+ more, merged into one ranked list every day.

Built with

  • Python
  • Airflow
  • PostgreSQL
  • Docker
  • Playwright
  • Streamlit
  • Claude Code

Project · Retail sales warehouse

One warehouse for sales, suppliers and departments

The problem

Sales, seller and product data sit in separate exports, so every report needs a day of cleaning and the totals never agree.

The solution

A pipeline that loads every order, item, seller and review into a star-schema warehouse, cleans it with dbt, and feeds a Power BI sales, supplier and late-delivery report.

How it works

  • Collect: Orders, items, sellers and reviews loaded as they are
  • Clean: dbt staging models set types, tidy names and keep one review per order
  • Model: A star schema of order facts with product, seller, customer and date dimensions
  • Report: Power BI sales, supplier and late-delivery pages

A closer look

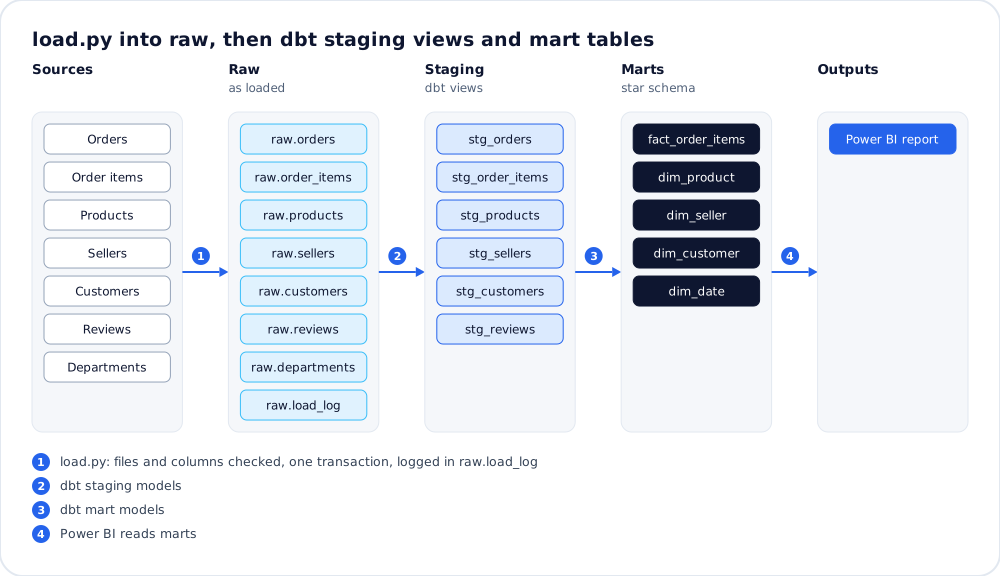
Pipeline diagram: seven input files load into raw tables, dbt staging views clean them, dbt mart tables form a star schema, and Power BI reads the marts.
How the input files become the warehouse.
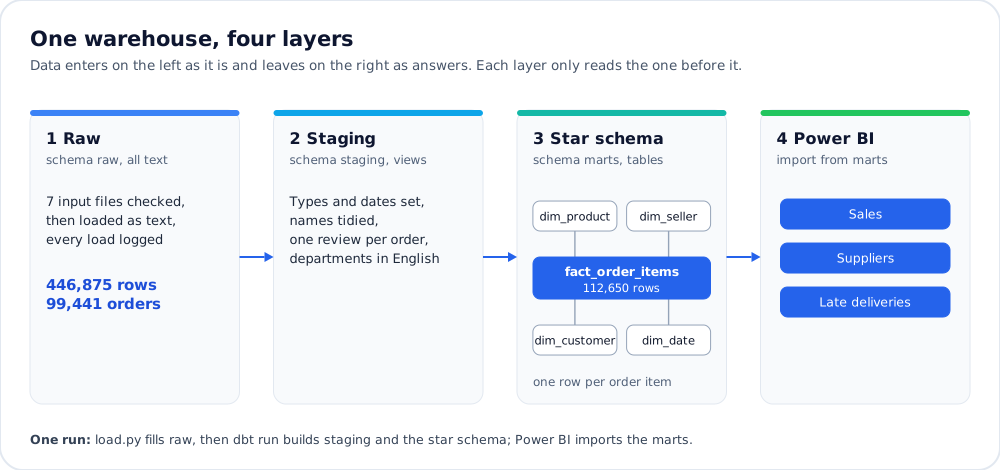
The warehouse in four layers, left to right: raw (7 input files, 446,875 rows, loaded as text), staging views, a star schema of one order-item fact (112,650 rows) and four dimensions, then the Power BI pages for sales, suppliers and late deliveries.
Each layer only reads the one before it.
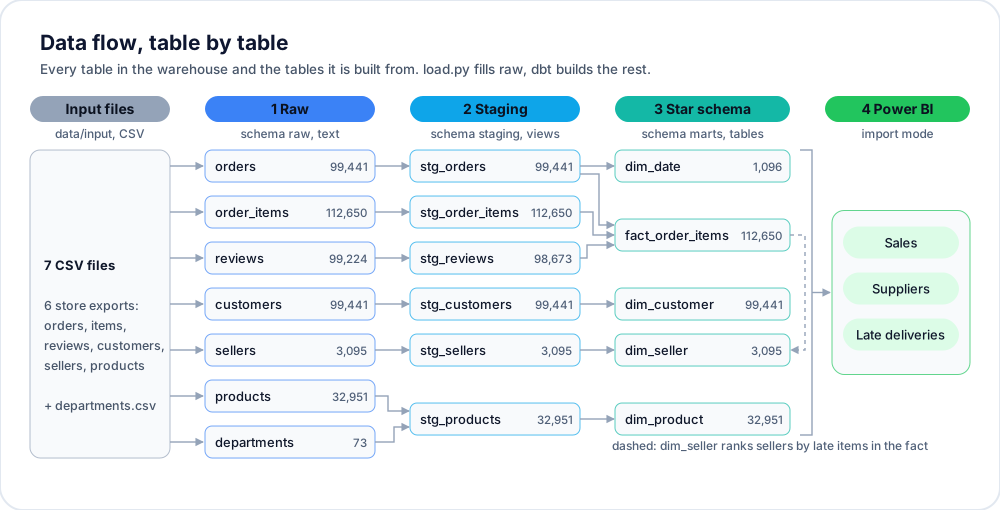
Data flow diagram: seven input files load into raw tables, dbt staging views clean them, and a star schema feeds three Power BI pages, with 99,441 orders, 112,650 order items, 3,095 sellers and 32,951 products carried through every step.
Every table, with its row count.
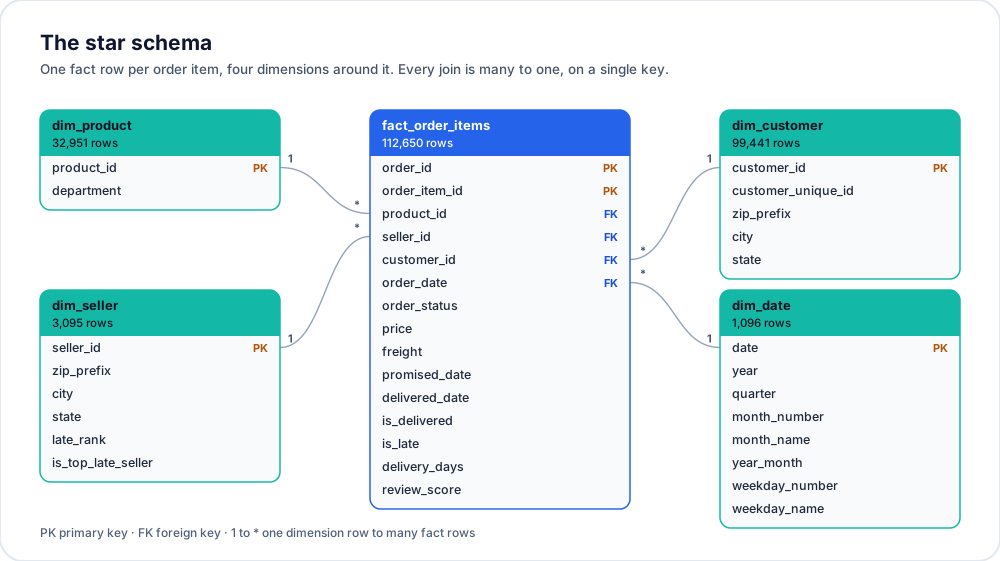
Star schema: one fact table of 112,650 order items joined to four dimensions of 99,441 customers, 3,095 sellers, 32,951 products and 1,096 dates.
One fact table, four dimensions.
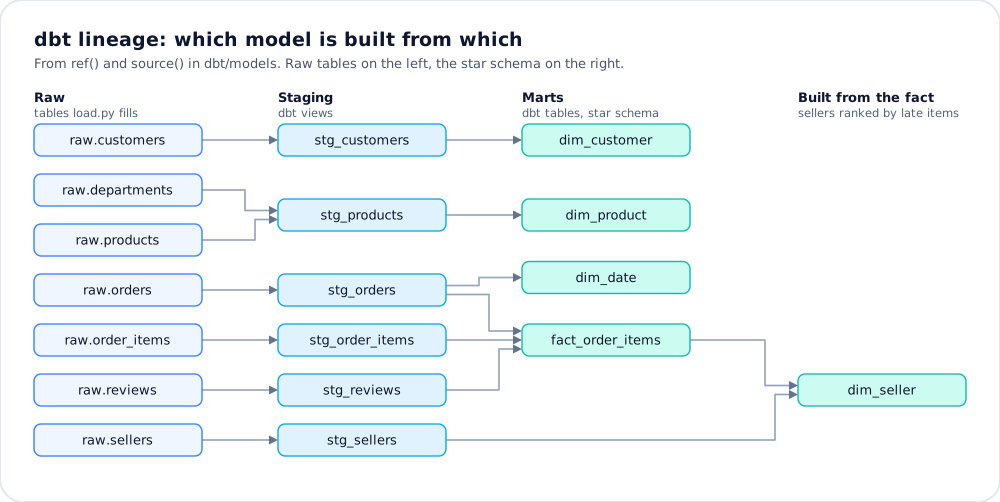
dbt lineage graph: seven raw tables feed six staging models, which build dim_customer, dim_product, dim_date, dim_seller and fact_order_items.
How dbt builds each table.
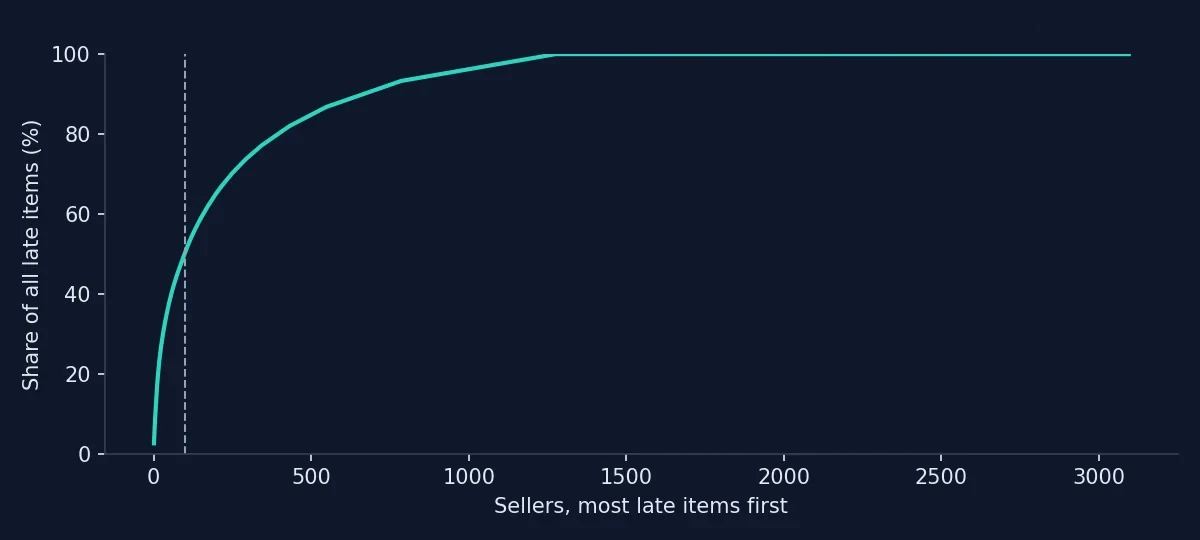
Chart: the running share of all late items by seller, most late first; 100 of 3,095 sellers cause 50% of late items.
100 sellers, half the late items.
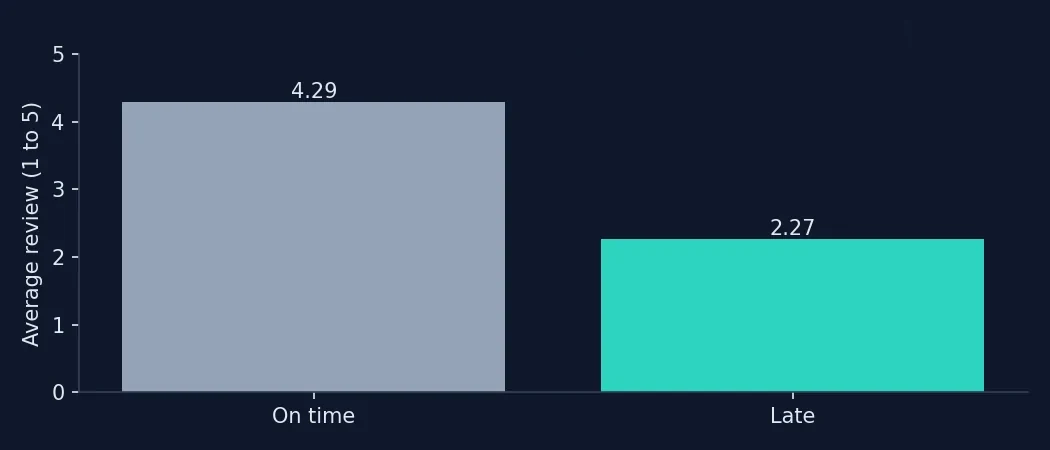
Chart: the average review is 4.29 out of 5 for orders delivered on time and 2.27 for late ones.
Late orders score 2.27 against 4.29.

The code

ranked = sellers.sort_values("late_rank").reset_index(drop=True)
cum = ranked.late_items.cumsum() / ranked.late_items.sum()
share = numbers["top sellers: share of late items"] * 100
fig, ax = plt.subplots(figsize=(8, 3.6))
ax.plot(range(1, len(cum) + 1), cum * 100, color=ACCENT, lw=2)
ax.axvline(TOP_N, color=GREY, ls="--", lw=1)
ax.set_xlabel("Sellers, most late items first")
ax.set_ylabel("Share of all late items (%)")
analysis/analysis.ipynb

The impact

  • One star schema for sales, sellers as suppliers, products and departments.
  • The 100 suppliers to call first: they ship 42% of items but cause half of the late ones.
  • Power BI sales, supplier and late-delivery pages on one trusted model.

The result

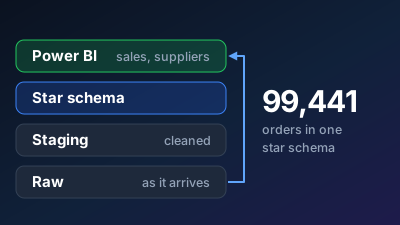
99,441 orders in one star schema: 100 of 3,095 sellers account for half of all late-delivered items.

Built with

  • PostgreSQL
  • dbt
  • Python
  • Docker
  • Power BI

Project · Branch Excel report

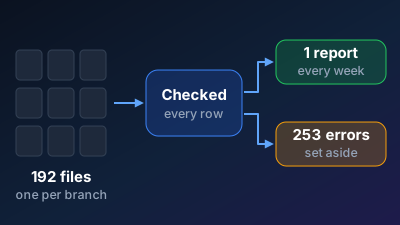
192 branch Excel files merged into one weekly report in one click

The problem

Every branch sends its own Excel file in its own format, so someone spends hours each week copying, fixing and pasting before anyone sees a total.

The solution

One script reads every branch file, cleans names, dates and amounts to one standard, sets aside rows that break the rules with the reason, and rebuilds the weekly report in Excel and Power BI in one click.

How it works

  • Collect: Every branch's monthly Excel file dropped in one folder
  • Clean: Names, dates, products and amounts fixed to one standard, duplicates removed
  • Check: Rows that break the rules set aside with the reason, never silently dropped
  • Merge: One clean, trusted table across all branches and months
  • Report: A weekly Excel and Power BI report rebuilt in one click

A closer look

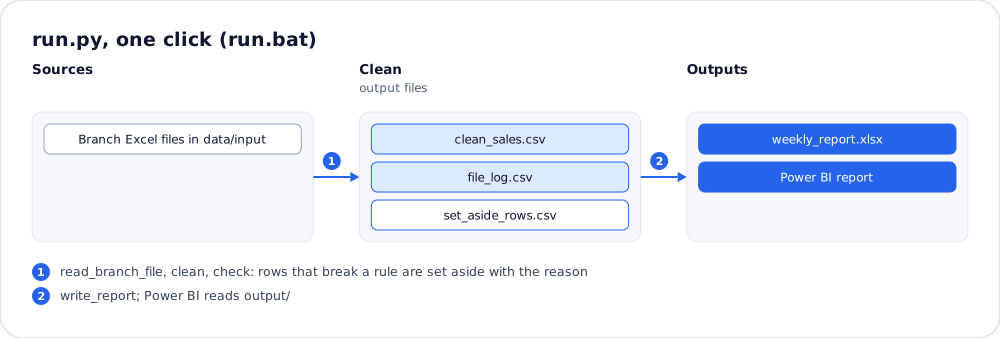
Pipeline diagram: the branch Excel files are read, cleaned and checked into a clean sales file, a file log and a file of set-aside rows, then the weekly Excel report and Power BI are rebuilt.
What the one-click run does, file by file.
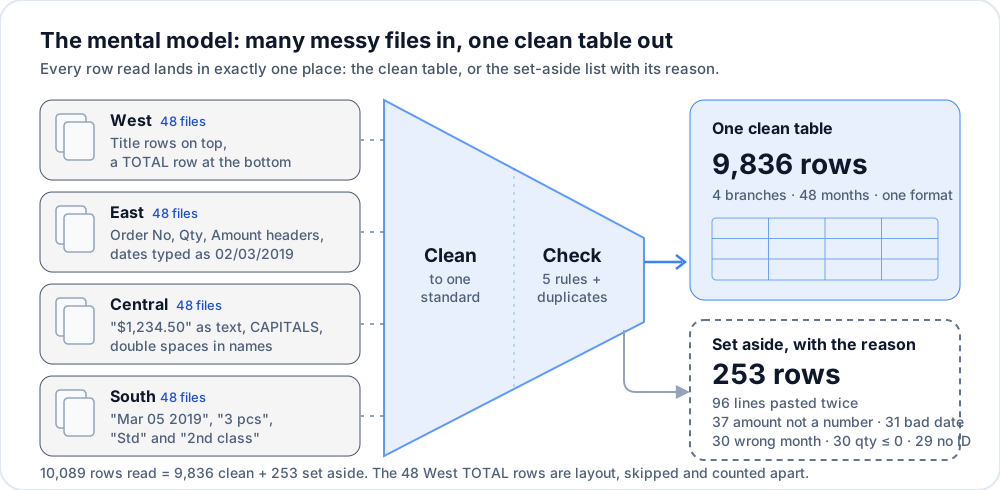
Mental model: 192 branch files from West, East, Central and South, each laid out its own way, are cleaned and checked into one table of 9,836 rows, and 253 rows are set aside with the reason: 96 pasted twice, 37 amounts not a number, 31 bad dates, 30 in the wrong month, 30 quantities of zero or less and 29 with no ID.
Many messy files in, one clean table out.
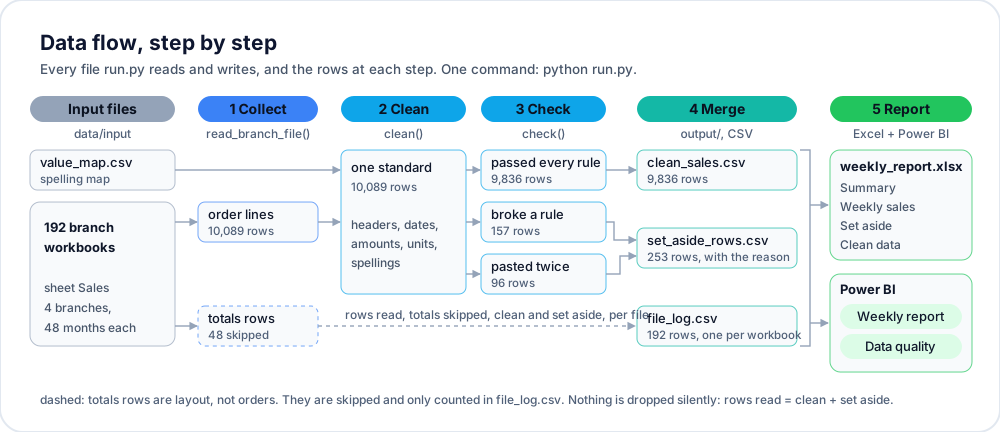
Data flow diagram: 192 branch workbooks give 10,089 order lines; 48 totals rows are skipped, 9,836 rows pass every rule and 253 are set aside (157 broke a rule, 96 were pasted twice) before the weekly Excel report and Power BI are rebuilt.
Every file the run reads and writes.
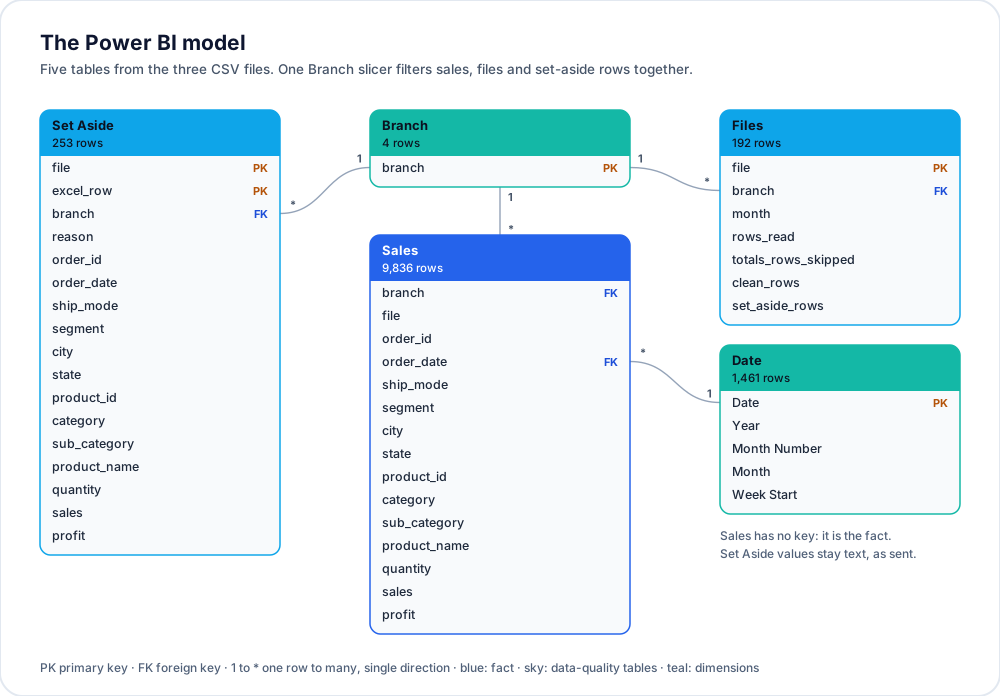
Power BI model: 9,836 sales rows, 253 set-aside rows and a log of 192 files, joined to 4 branches and 1,461 dates, so one branch slicer filters all three.
Sales and data-quality tables share one branch slicer.
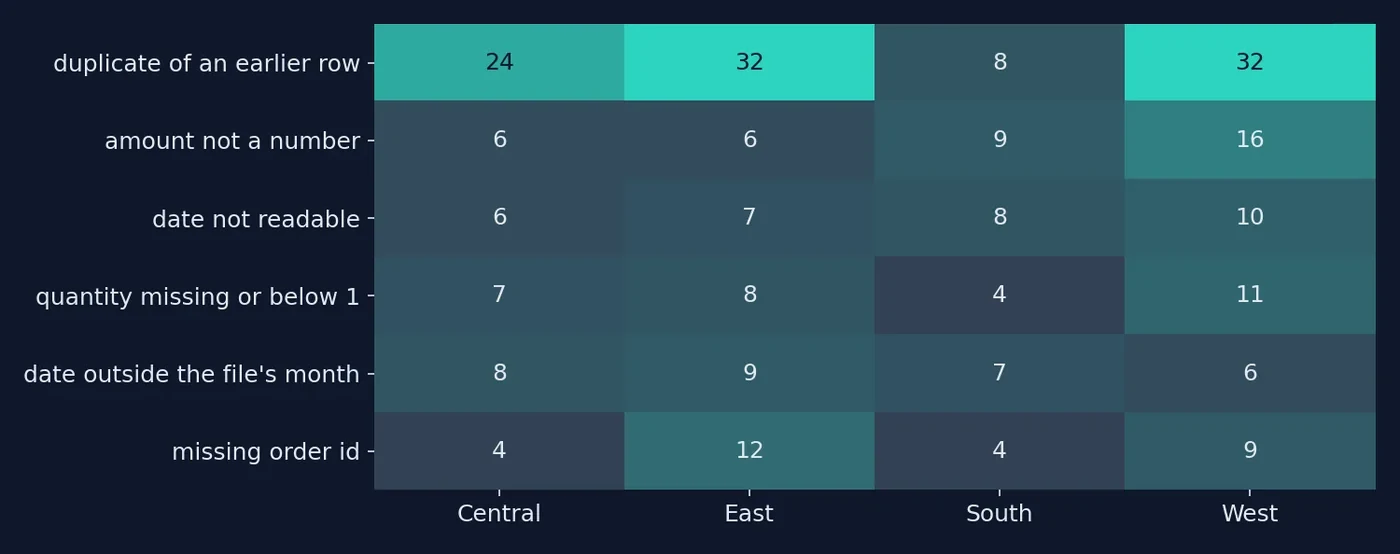
Chart: the 253 set-aside rows by mistake and branch; West has 84, East 74, Central 55 and South 40, and duplicates are the biggest mistake in West and East with 32 each.
Where each kind of mistake comes from.
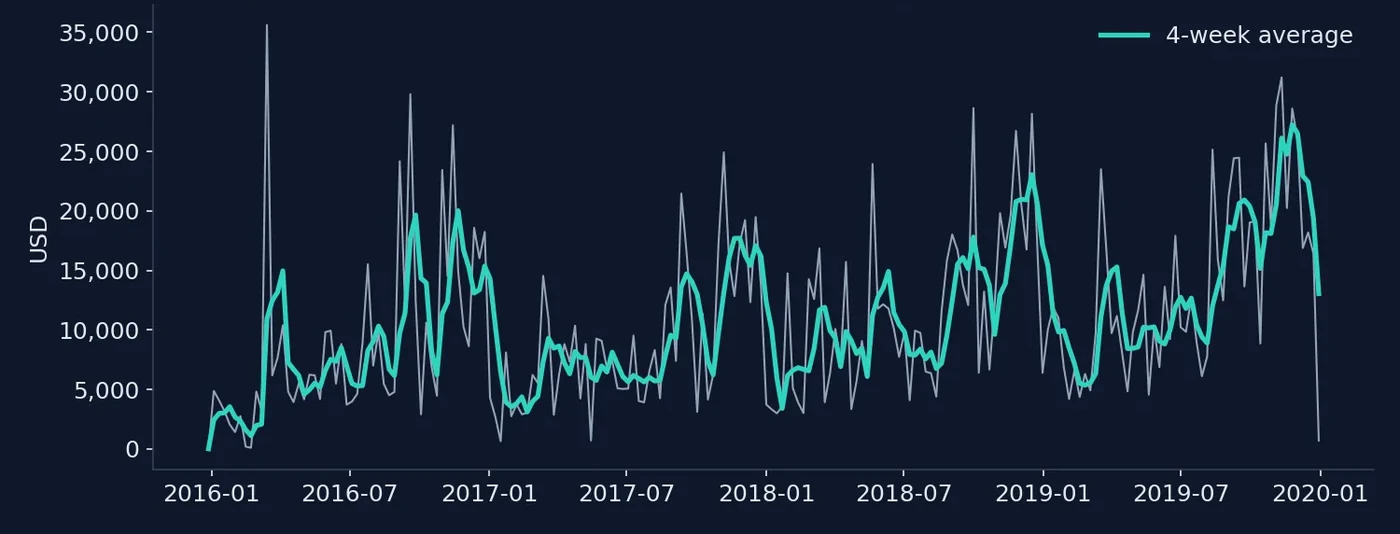
Chart: weekly sales for all branches from January 2016 to December 2019, built from the one clean table, with a four-week average that climbs each autumn.
Weekly sales, from the one clean table.

The code

order_date: [Order Date, Date]
ship_mode: [Ship Mode, Shipping]
segment: [Segment, Customer Type]
city: [City]
state: [State]
product_id: [Product ID, SKU]
category: [Category]
sub_category: [Sub-Category, Subcategory]
product_name: [Product Name, Item]
quantity: [Quantity, Qty]
sales: [Sales, Amount]
profit: [Profit]
config/client.yaml

The impact

  • Hours of copy, paste and VLOOKUP replaced by one click.
  • Every branch in the same format, so totals match.
  • Bad rows listed with the reason, so they get fixed at the source.

The result

10,089 rows across 192 branch files: 253 errors caught and set aside with the reason, report rebuilt in under a minute.

Built with

  • Python
  • pandas
  • Excel
  • Power Query
  • Power BI

Project · Supplier scorecard

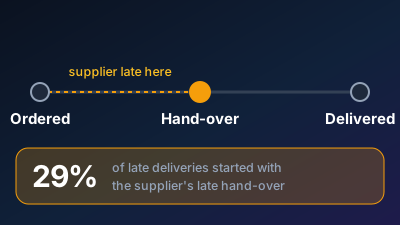
Showing the suppliers behind 29% of late deliveries

The problem

Buyers can't see which suppliers and departments deliver late or short until shelves run empty.

The solution

A Power BI supplier scorecard on a star-schema model: on-time-in-full, fill rate and late rate by supplier and department, a watch list of the suppliers to call, each buyer seeing only their department, and a short written summary of each week.

How it works

  • Load: Orders, suppliers and departments into a star schema, checked on every load
  • Rules: On-time-in-full, fill rate and late rate written once in DAX
  • Secure: Row-level security: each buyer sees only their department
  • Explain: A local LLM writes each department's weekly summary, every number checked
  • Report: Power BI scorecard, reloaded from source on demand

A closer look

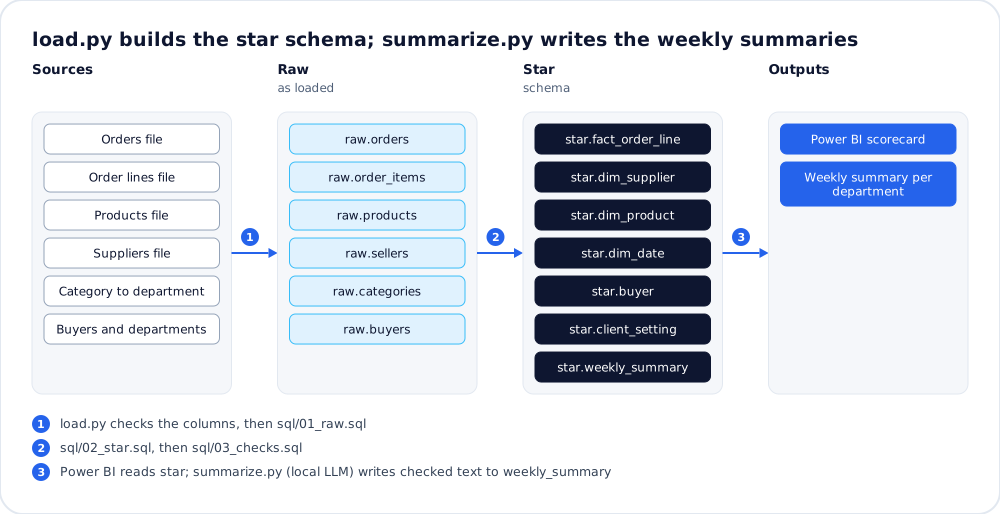
Pipeline diagram: order, product, supplier, category and buyer files load into raw tables; SQL builds a star schema that Power BI reads, and a local LLM writes a checked weekly summary per department.
How the input files become the scorecard and the weekly summaries.
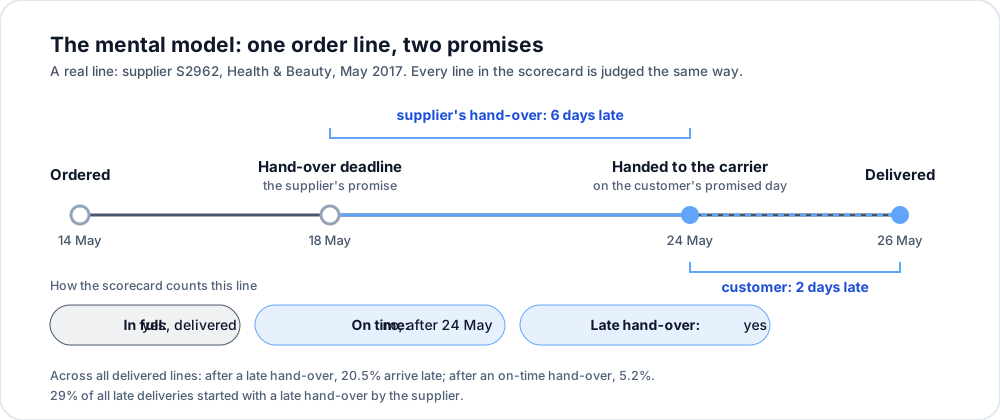
Mental model: one real order line, ordered on 14 May, handed to the carrier six days after the supplier's 18 May deadline and delivered two days late; after a late hand-over 20.5% of lines arrive late, against 5.2% after an on-time one.
One order line, two promises.
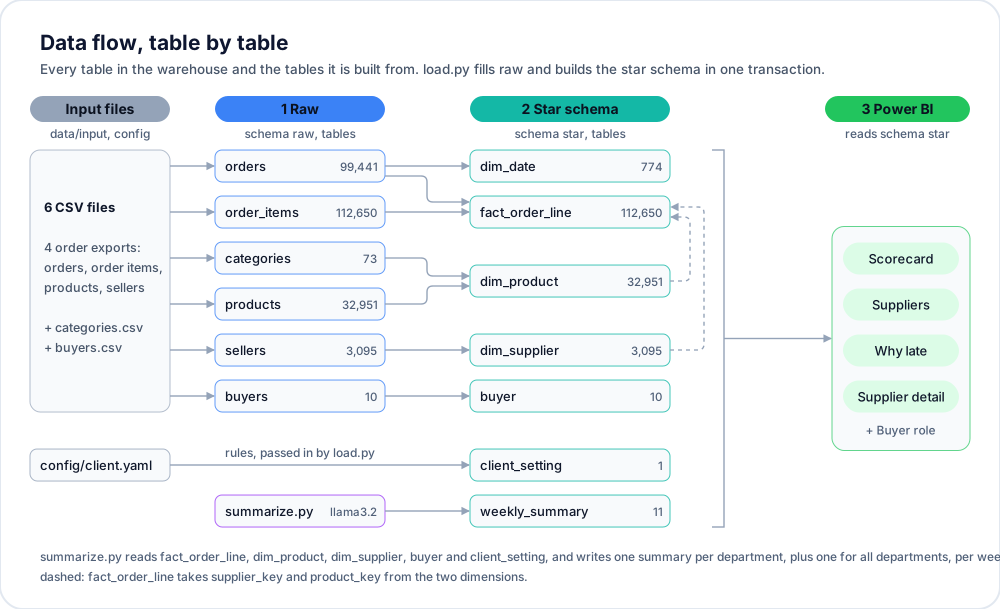
Data flow diagram: six input files load into raw tables and a star schema of 112,650 order lines, 3,095 suppliers and 32,951 products; Power BI reads it, and a local model writes 11 weekly summaries, one per department plus one for all.
Every table, with its row count.
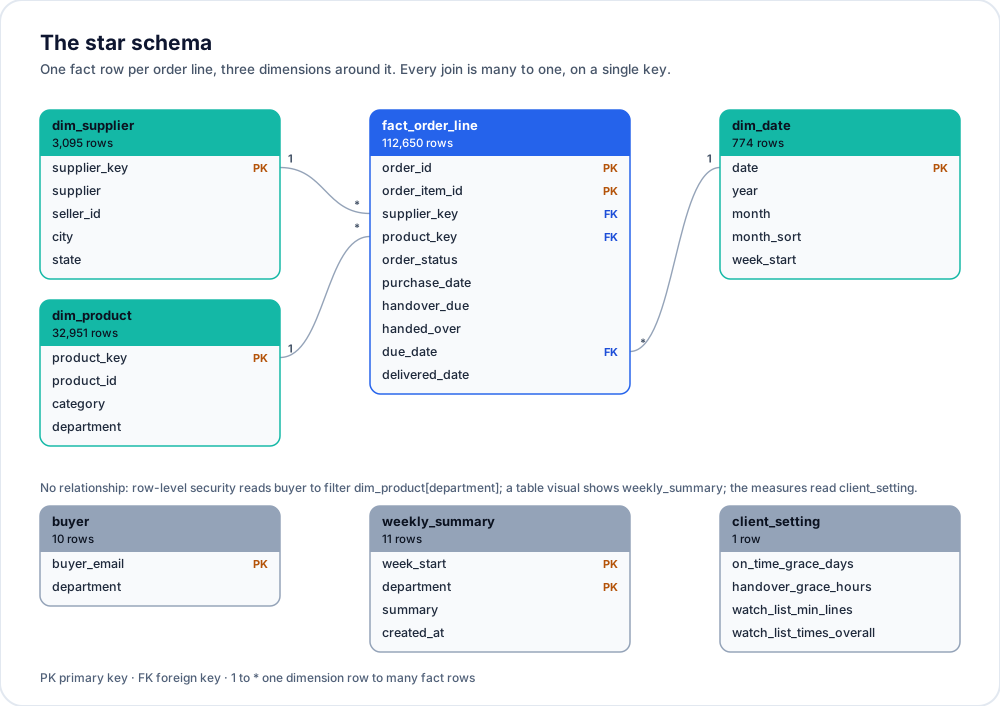
Star schema: one fact table of 112,650 order lines joined to 3,095 suppliers, 32,951 products and 774 dates, with side tables for 10 buyers, 11 weekly summaries and one row of client settings.
One fact table, three dimensions.
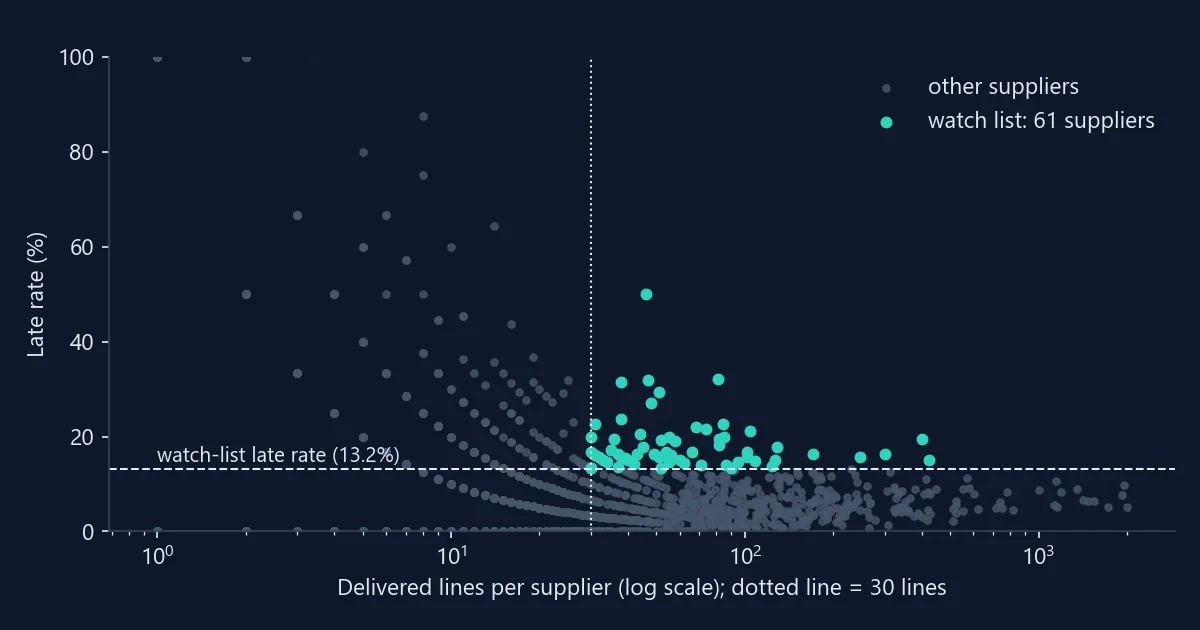
Chart: late rate against delivered lines for every supplier, on a log scale; the 61 watch-list suppliers have 4.4% of deliveries, 12% of late ones and a late rate of 13.2% together.
The 61 suppliers to watch.
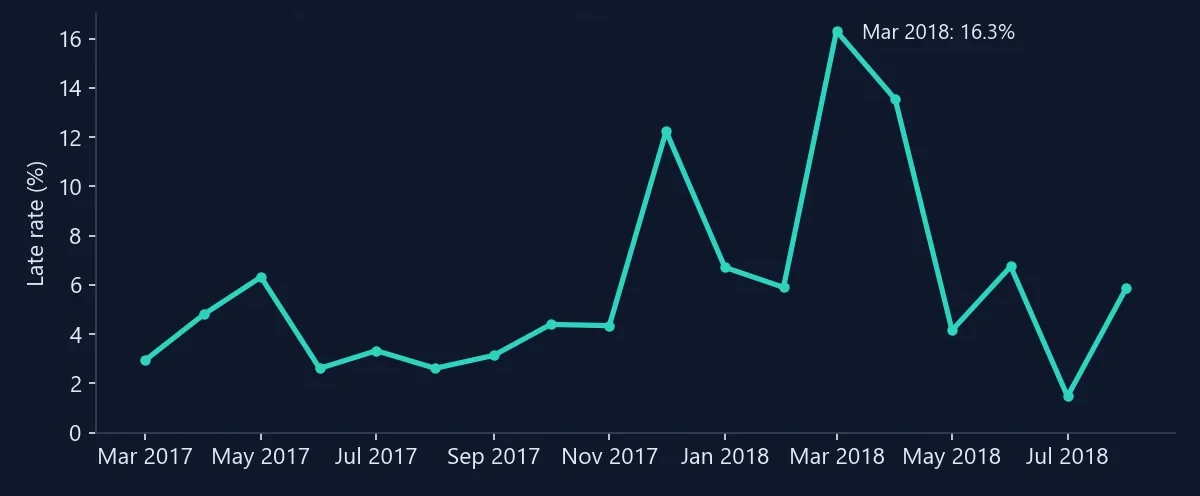
Chart: late deliveries by promised month, March 2017 to August 2018, between 1.5% and 6.8% in most months, with peaks of 12.2% in December 2017 and 16.3% in March 2018.
Late rate by promised month.

The code

WORST_SUPPLIER_SQL = """
SELECT s.supplier, COUNT(*) AS late_lines
FROM star.fact_order_line f
JOIN star.dim_product p  USING (product_key)
JOIN star.dim_supplier s USING (supplier_key)
CROSS JOIN star.client_setting c
WHERE DATE_TRUNC('week', f.due_date)::date = %(week)s
  AND f.delivered_date > f.due_date + c.on_time_grace_days
summarize.py

The impact

  • One trusted score per supplier and department.
  • Late deliveries traced back to the supplier's late hand-over.
  • Each buyer sees only their own department.
  • A plain-language summary of the week beside the charts.

The result

98,666 orders: 29% of late deliveries started with a supplier's late hand-over, and 61 suppliers with 4.4% of deliveries accounted for 12% of them.

Built with

  • Power BI
  • DAX
  • Power Query
  • PostgreSQL
  • Python
  • Ollama

Project · Stock reorder dashboard

Flagging best sellers before they run out

The problem

Best sellers run out before anyone notices while slow items fill the shelves, because stock is checked by hand and too late.

The solution

A daily pipeline loads sales and stock, works out days of cover and a reorder point per item, emails the morning reorder list, and shows stock risk in Power BI.

How it works

  • Load: Daily sales and stock per store and item into a warehouse, checked on every load
  • Forecast: Expected daily demand per item from recent sales
  • Rules: Days of cover, reorder point and safety stock written once, counting orders on the way
  • Alert: An email each morning listing the items to reorder and how many
  • Report: A Power BI stock report: what to reorder, what is empty, what sits too long

A closer look

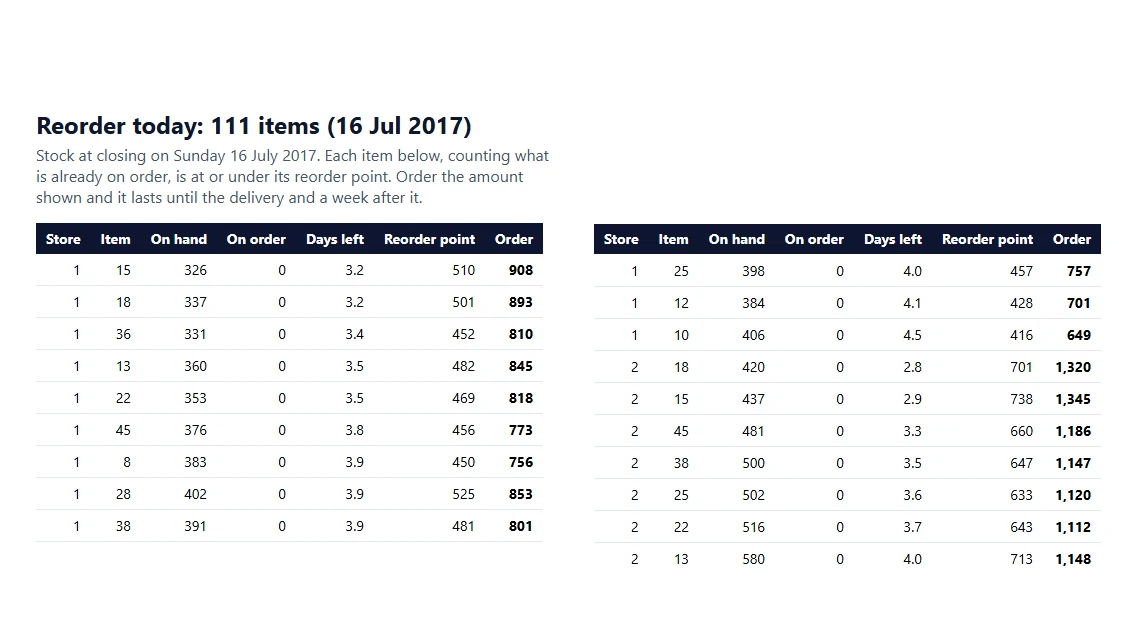
Reorder email for one morning: a table of store, item, units on hand, units on order, days left, reorder point and the amount to order.
The reorder email, sent every morning.
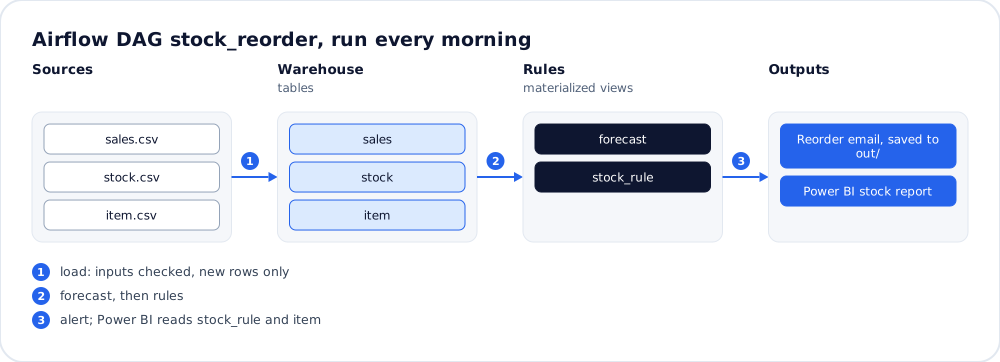
Pipeline diagram: sales, stock and item files load into warehouse tables; materialized views work out the forecast and the stock rules for a reorder email and a Power BI stock report.
The daily pipeline, from the sales and stock files to the reorder list.
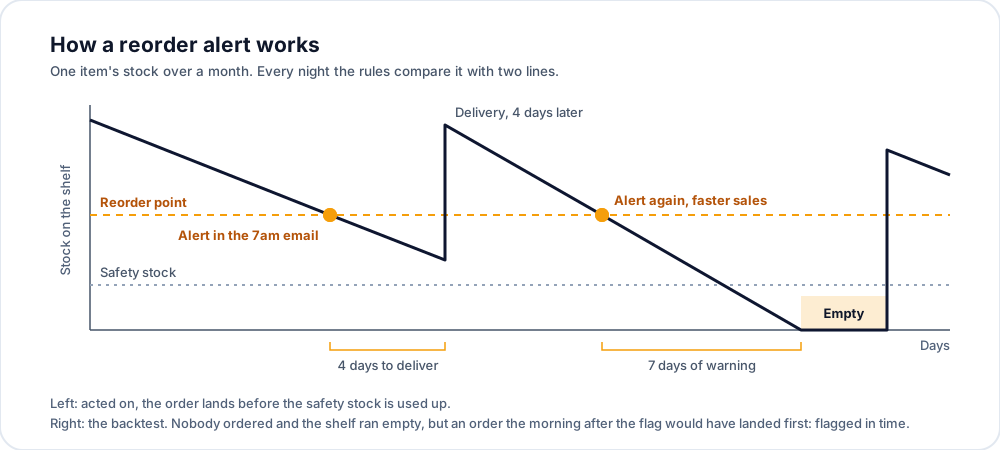
How a reorder alert works: one item's stock falls to the reorder point and the 7am email raises an alert; the delivery lands four days later, before the safety stock runs out, and when a later alert is ignored the shelf runs empty after seven days of warning.
One item's stock against two lines.
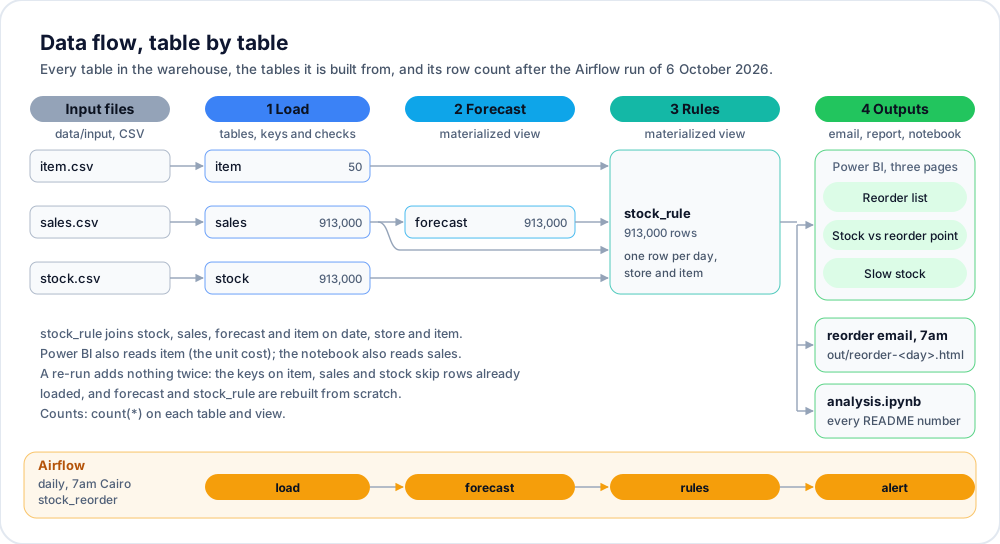
Data flow diagram: item, sales and stock files load into tables of 50 items and 913,000 sales and stock rows; a forecast and the stock rules, 913,000 rows each, feed the 7am reorder email, three Power BI pages and the analysis notebook.
Every table, with its row count after a run.
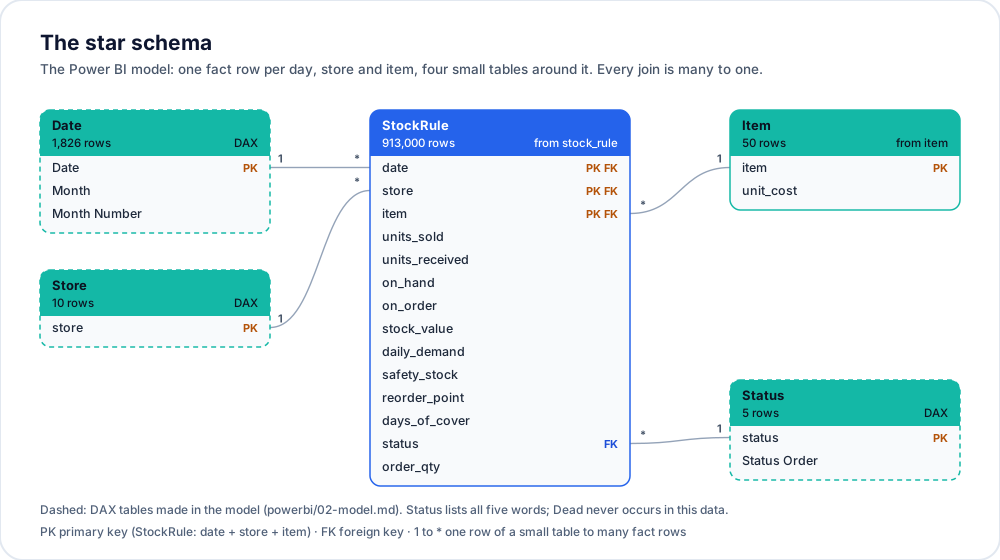
Star schema of the Power BI model: one fact table of 913,000 rows, one per day, store and item, joined to 1,826 dates, 10 stores, 50 items and 5 stock statuses.
One fact table, four small tables.
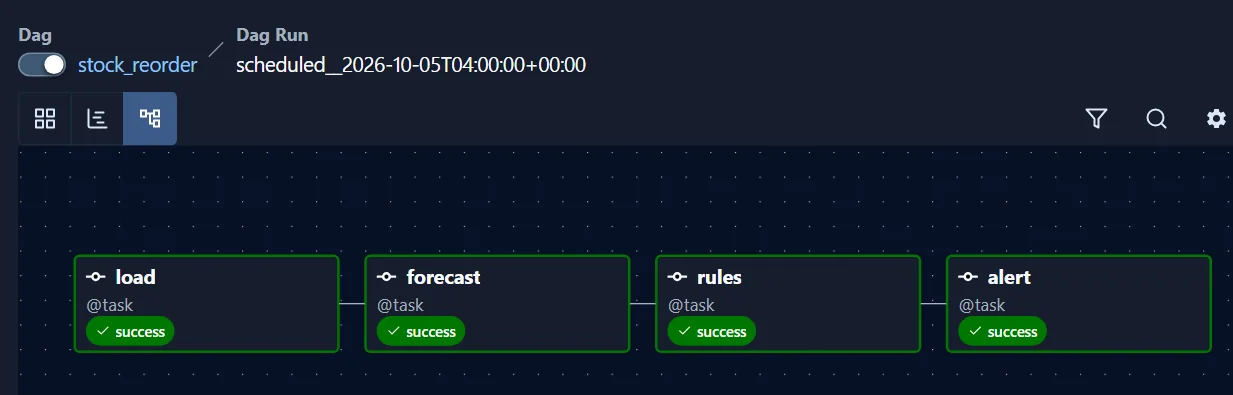
Airflow graph view of a daily stock_reorder run: load, forecast, rules and alert, all four tasks successful.
The Airflow DAG, run every morning.
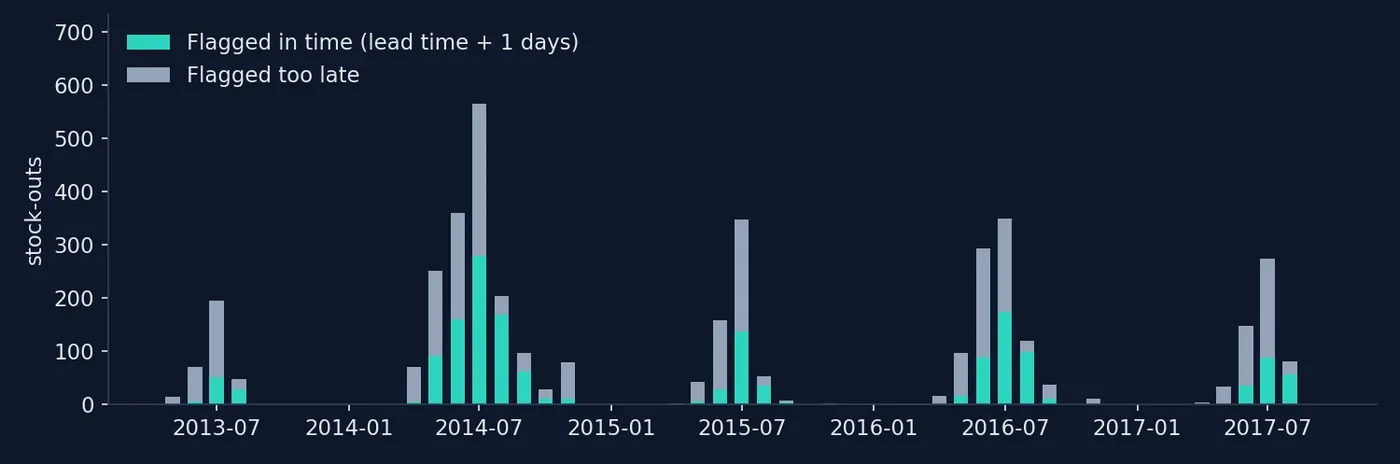
Chart: stock-outs per month from 2013 to 2017, coming every summer and highest in July 2014; of 4,052 stock-outs, 1,643 were flagged in time to reorder.
Stock-outs per month, flagged in time or too late.

The code

@task
def rules():
    import pipeline
    pipeline.rules()

@task
def alert():
    import pipeline
    pipeline.alert()

load() >> forecast() >> rules() >> alert()
dags/stock_reorder.py

The impact

  • A reorder list every morning, before the shelf is empty.
  • Overstocked and dead items visible, so cash stops sitting on shelves.
  • One rule for days of cover and safety stock, used by every store.

The result

913,000 sales rows: 1,643 stock-outs flagged in time to reorder, and 37% of stock value found in slow items.

Built with

  • Power BI
  • DAX
  • PostgreSQL
  • Python
  • Airflow

Project · Daily cash dashboard

Knowing where 76% of the money comes from, every day

The problem

The owner learns how much cash came in only at month end, from a spreadsheet nobody trusts, so late payments and weak days are found too late.

The solution

A Power BI cash page on a star schema: money in by day, payment method and region, what is still due on instalments, and what is late, with every total matching the source.

How it works

  • Load: Orders and payments by method, instalment and day
  • Rules: Cash in, cash still due and late payments defined once
  • Model: A star schema with a date table, so every day, month and year adds up
  • Report: A daily cash page: what came in, what is due and what is late

A closer look

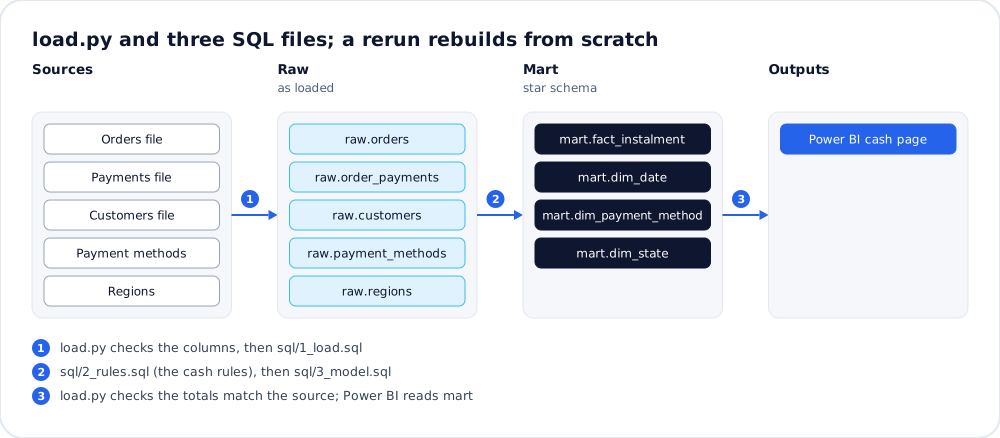
Pipeline diagram: order, payment, customer, payment method and region files load into raw tables; SQL rules build a star schema around an instalment fact, which Power BI reads.
How the input files become the cash page.
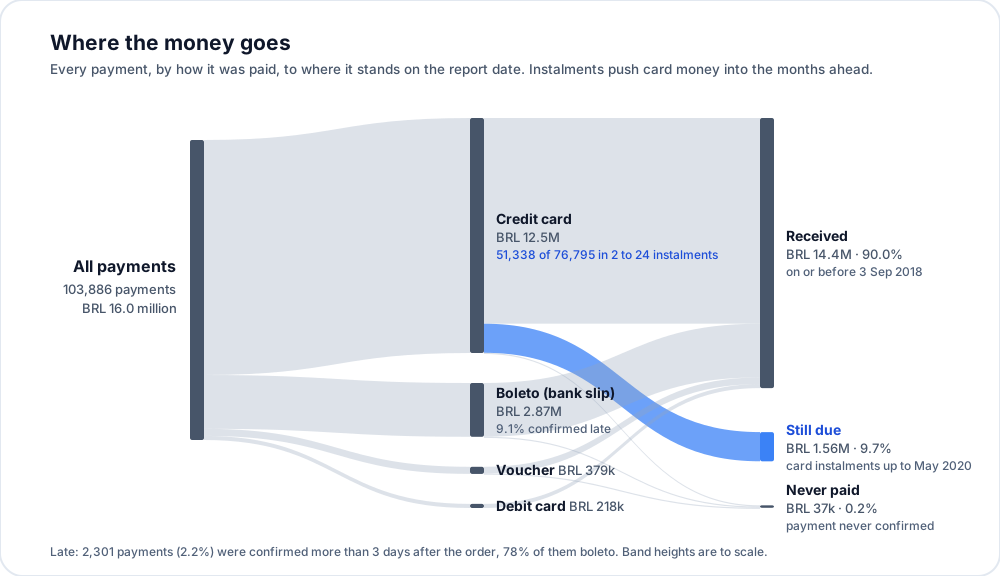
Where the money goes: 103,886 payments (BRL 16.0 million) by how they were paid, to received (BRL 14.4M, 90.0%), still due on card instalments (BRL 1.56M, 9.7%) and never paid (BRL 37k, 0.2%).
Instalments push card money into the months ahead.
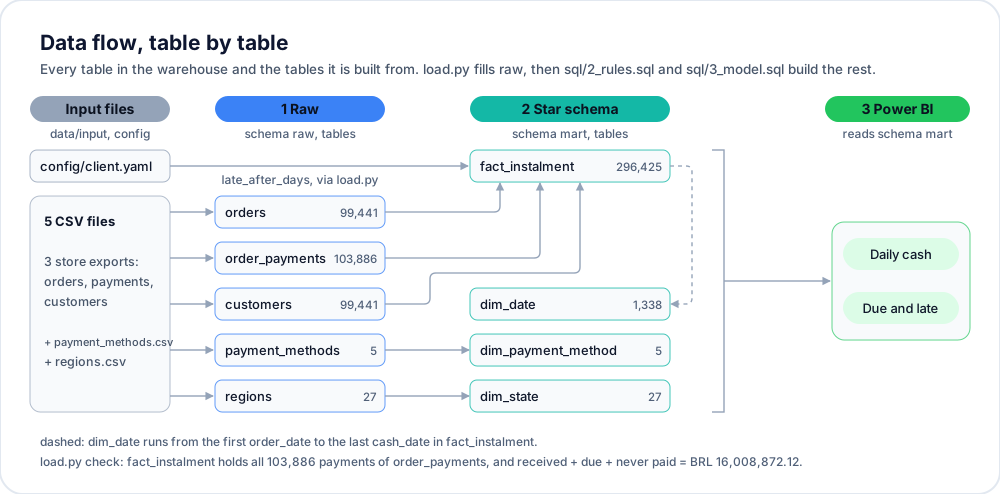
Data flow diagram: five input files with 99,441 orders and 103,886 payments load into raw tables; SQL rules split the payments into 296,425 instalments in a star schema that Power BI reads.
Every table, with its row count.
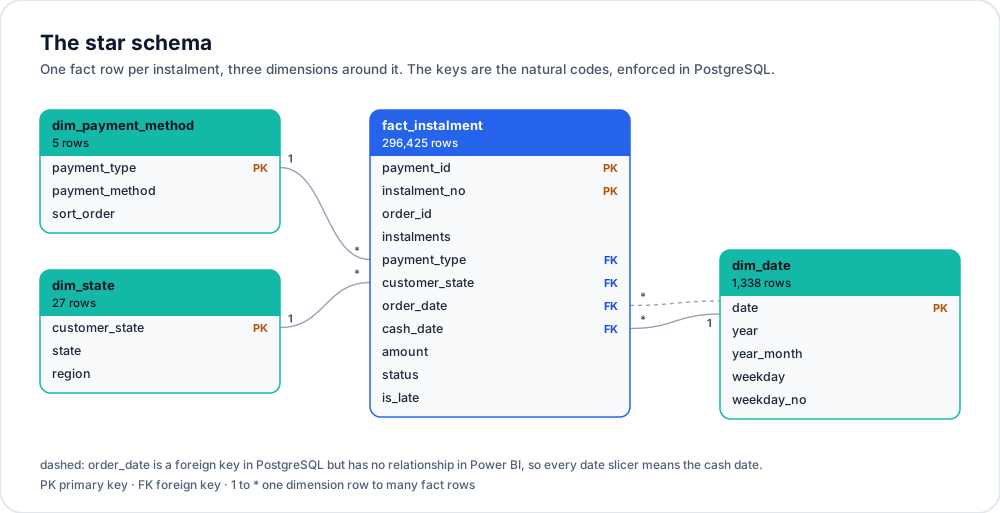
Star schema: one fact table of 296,425 instalments joined to 5 payment methods, 27 states and 1,338 dates.
One fact table, three dimensions.
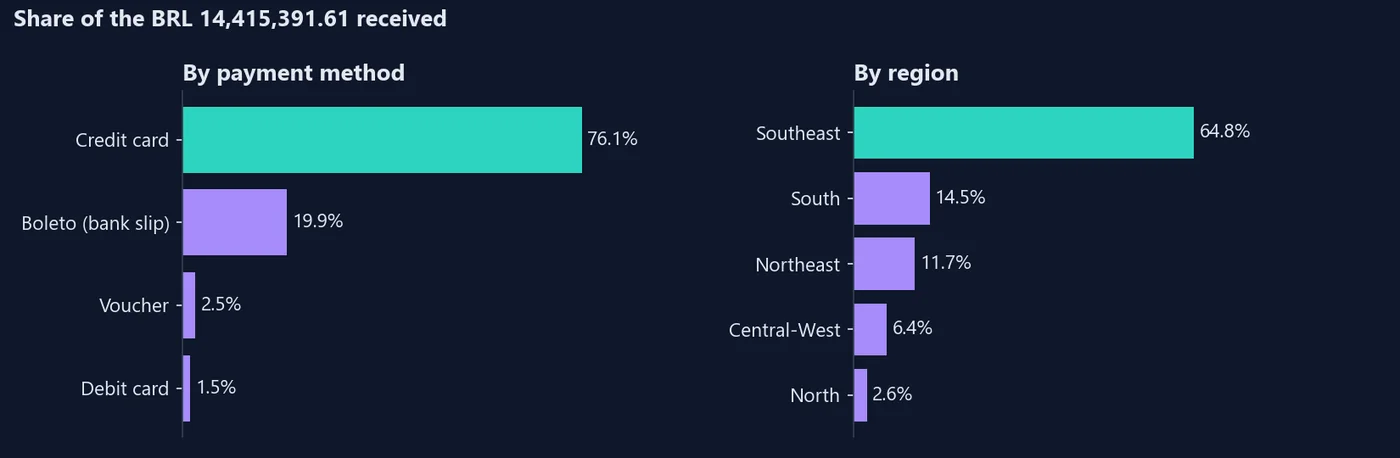
Chart: the BRL 14,415,391.61 received, by payment method (credit card 76.1%, boleto bank slip 19.9%, voucher 2.5%, debit card 1.5%) and by region (Southeast 64.8%, South 14.5%, Northeast 11.7%, Central-West 6.4%, North 2.6%).
Where the cash comes from.
Chart: cash received each month up to the report date of 3 September 2018, peaking above BRL 1.1 million a month, then the card instalments still due after it, BRL 1.56 million in all.
Cash received, then instalments still to come.
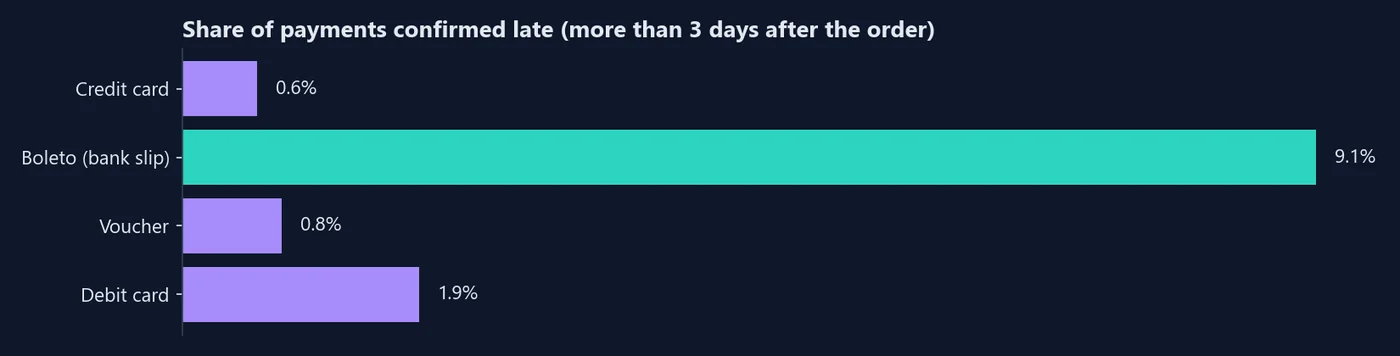
Chart: the share of payments confirmed more than three days after the order is 9.1% for boleto bank slips, 1.9% for debit cards, 0.8% for vouchers and 0.6% for credit cards.
Boleto payments are confirmed late most often.

The code

select
    i.payment_id,
    i.order_id,
    i.instalment_no,
    i.instalments,
    i.payment_type,
    i.customer_state,
    i.order_date,
    i.cash_date,
    i.amount,
    case when i.cash_date is null       then 'Never paid'
         when i.cash_date <= r.report_date then 'Received'
         else 'Due'
    end as status,
sql/2_rules.sql

The impact

  • Today's cash on one page, not at month end.
  • Instalments still due and late payments listed.
  • The payment methods and regions that bring the money in.

The result

103,886 payments: 76% of the cash in arrived by credit card, and BRL 1.56 million was still due on instalments.

Built with

  • Power BI
  • DAX
  • Power Query
  • PostgreSQL
  • SQL

Project · Customer segments

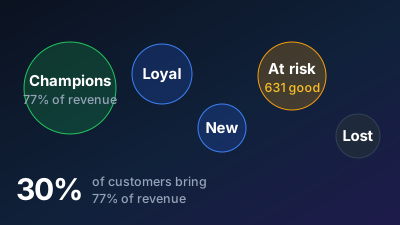
Finding the 30% of customers who bring 77% of revenue, and who is slipping away

The problem

The business treats every customer the same, so it spends on people who would buy anyway and loses good customers without noticing.

The solution

An analysis that scores every customer on recency, frequency and spend, groups them into champions, loyal, new, at risk and lost, tracks how each starting month's customers return, and shows who to contact first in Power BI.

How it works

  • Clean: Invoices cleaned: returns, cancelled orders and missing customers handled
  • Score: Each customer scored on how recently, how often and how much they buy
  • Group: Customers grouped into champions, loyal, new, at risk and lost
  • Cohorts: How many customers from each starting month come back
  • Report: A Power BI page per group, with who to call first

A closer look

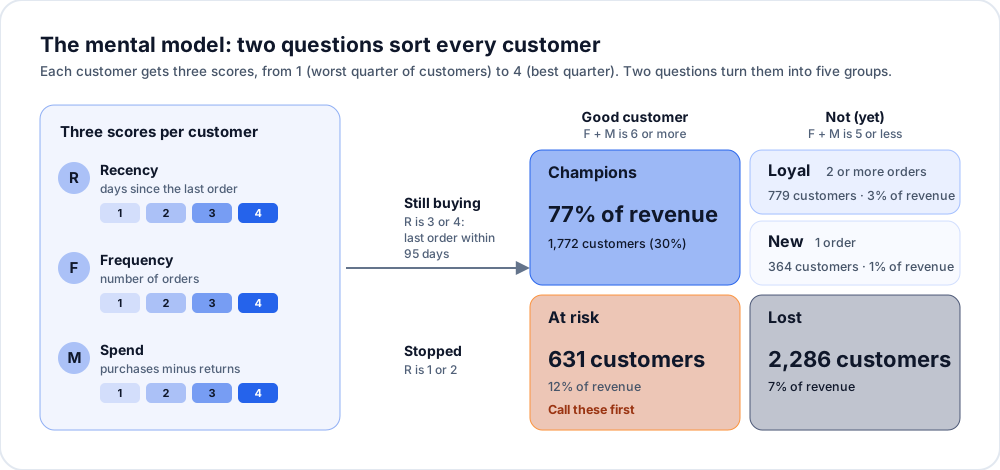
Mental model: every customer gets a recency, frequency and spend score from 1 to 4, and two questions sort them into 1,772 champions with 77% of revenue, 779 loyal, 364 new, 631 at risk with 12% of revenue, and 2,286 lost.
Two questions sort every customer into five groups.
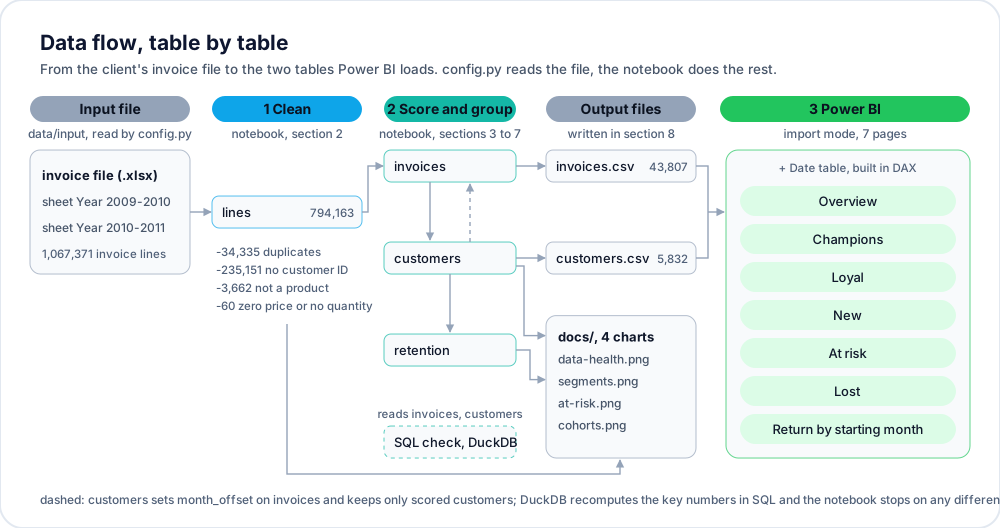
Data flow diagram: an invoice file of 1,067,371 lines in two yearly sheets is cleaned to 794,163 lines, grouped into 43,807 invoices and 5,832 scored customers, checked again in SQL, and loaded into seven Power BI pages.
Every table, with its row count.
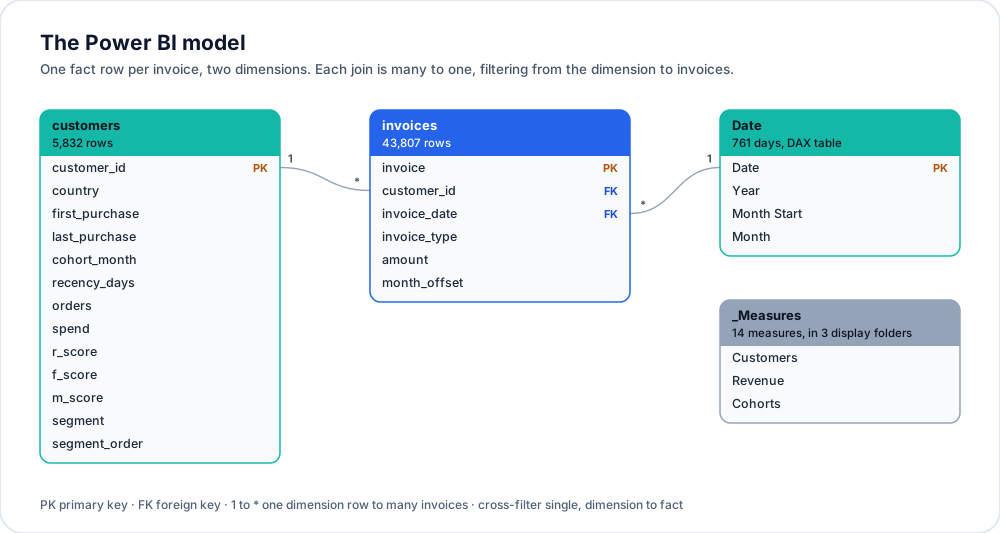
Power BI model: one fact table of 43,807 invoices joined to 5,832 scored customers and a date table of 761 dates, with 14 measures.
One fact table, two dimensions.
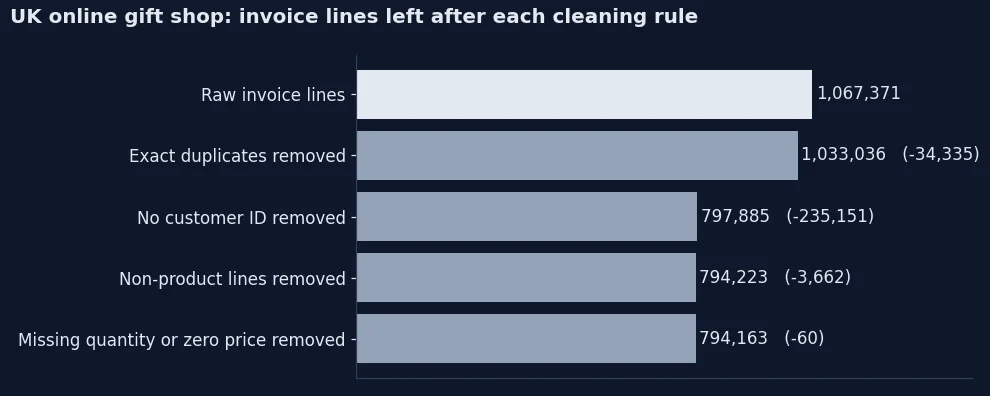
Chart: 1,067,371 raw invoice lines drop to 794,163 after four cleaning rules remove 34,335 exact duplicates, 235,151 lines with no customer ID, 3,662 non-product lines and 60 lines with no quantity or a zero price.
The lines each cleaning rule removes.
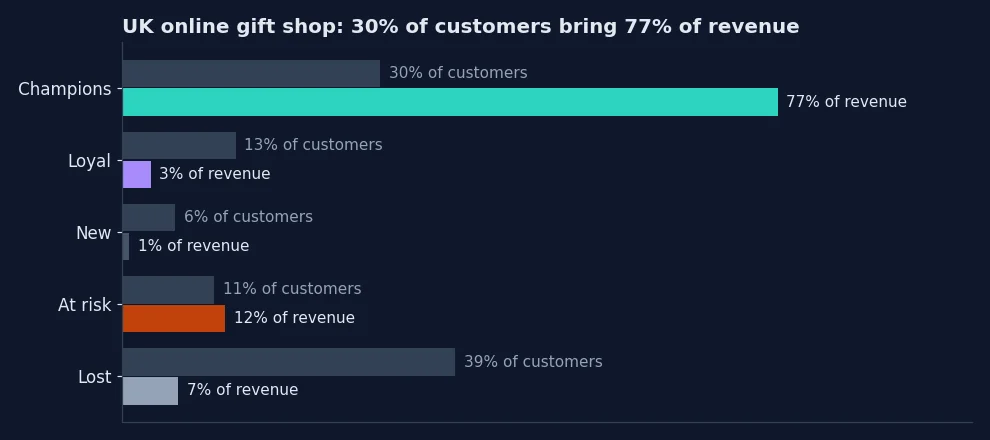
Chart: champions are 30% of customers and bring 77% of revenue; loyal are 13% with 3%, new 6% with 1%, at risk 11% with 12%, and lost 39% with 7%.
Share of customers against share of revenue.
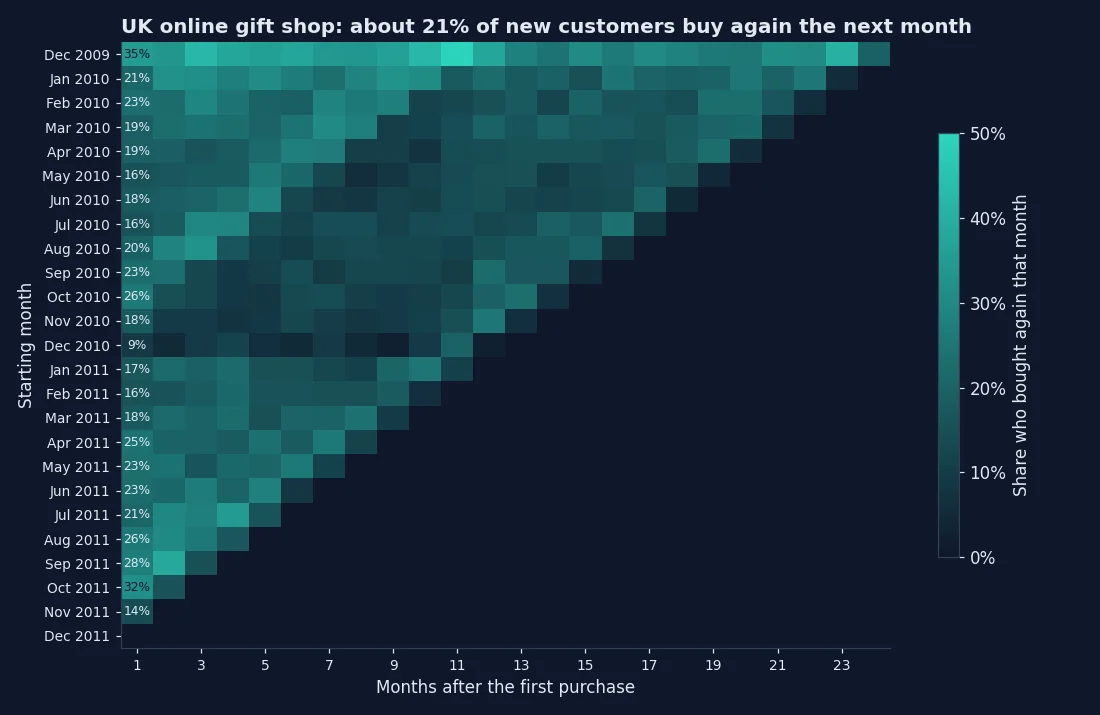
Cohort chart: for each starting month from December 2009 to December 2011, the share of customers who bought again in each later month; about 21% buy again the next month, from 9% for December 2010 to 35% for December 2009.
How many of each month's new customers come back.

The code

still_buying = customers.r_score >= RULES["still_buying_min_recency_score"]
good = customers.f_score + customers.m_score >= RULES["good_customer_min_frequency_plus_spend"]
customers["segment"] = np.select(
    [still_buying & good, still_buying & (customers.orders == 1), still_buying, good],
    ["Champions", "New", "Loyal", "At risk"],
    default="Lost",
)
analysis/analysis.ipynb

The impact

  • The customers who bring most of the revenue, named: 1,772 champions bring 77% of it.
  • 631 good customers who stopped buying, listed biggest spender first.
  • Return rates by starting month: 20.8% of new customers buy again the next month.

The result

36,573 invoices: 30% of customers bring 77% of revenue, and 631 good customers are at risk.

Built with

  • Python
  • pandas
  • SQL
  • Power BI
  • DAX

Project · Competitor price tracker

Knowing every competitor price change on 356 products, every week

The problem

Prices are checked by hand on a few competitor sites now and then, so the business finds out it was undercut after the sales are gone.

The solution

A weekly pipeline reads competitor prices, matches each product to the client's own, keeps every price with its date, emails an alert when a key product is undercut, and shows price gaps in Power BI.

How it works

  • Collect: Competitor prices read every week, from product pages and published shelf prices
  • Match: Each competitor product matched to the client's own product, by barcode or by name
  • Store: Every price kept with its date, so changes become history
  • Alert: An email when a competitor undercuts a key product
  • Report: Power BI pages of price gaps and changes by product

A closer look

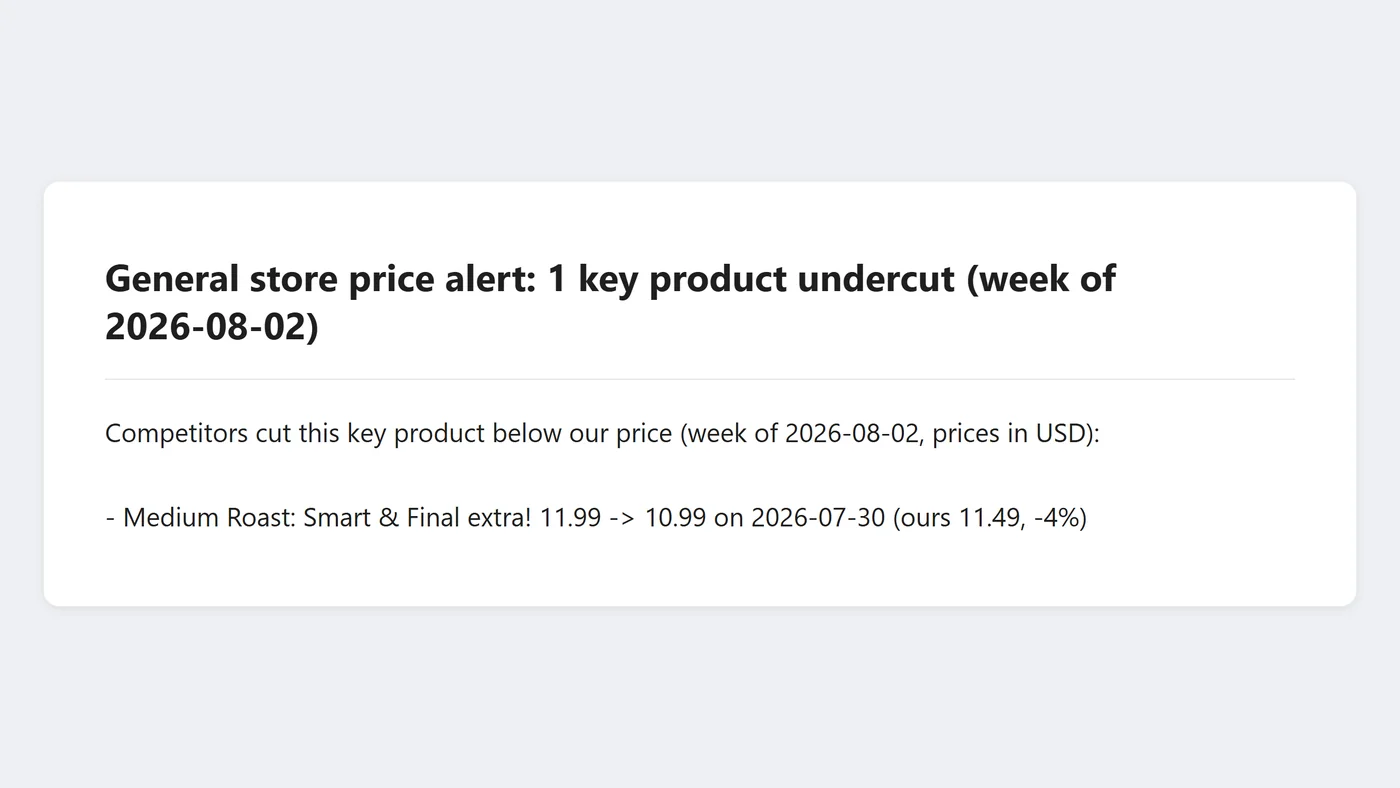
The alert email for the week of 2 August 2026: Smart & Final extra! cut Medium Roast from 11.99 to 10.99 on 30 July 2026, below our 11.49, a 4% undercut.
The email the run sent when a key product was undercut.
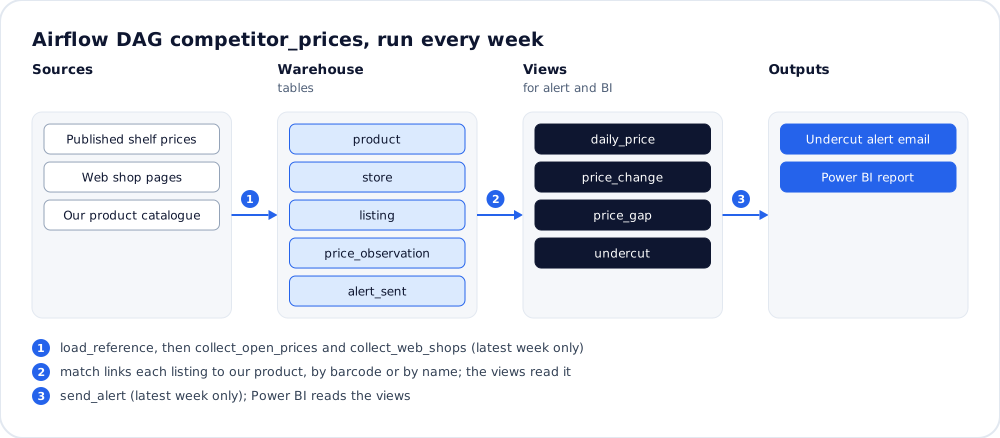
Pipeline diagram: published shelf prices, web shop pages and our catalogue load into warehouse tables; views work out price changes, gaps and undercuts for an alert email and a Power BI report.
The weekly pipeline, from competitor prices to the alert and the report.
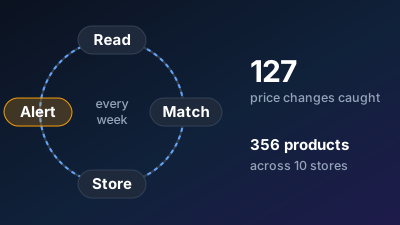
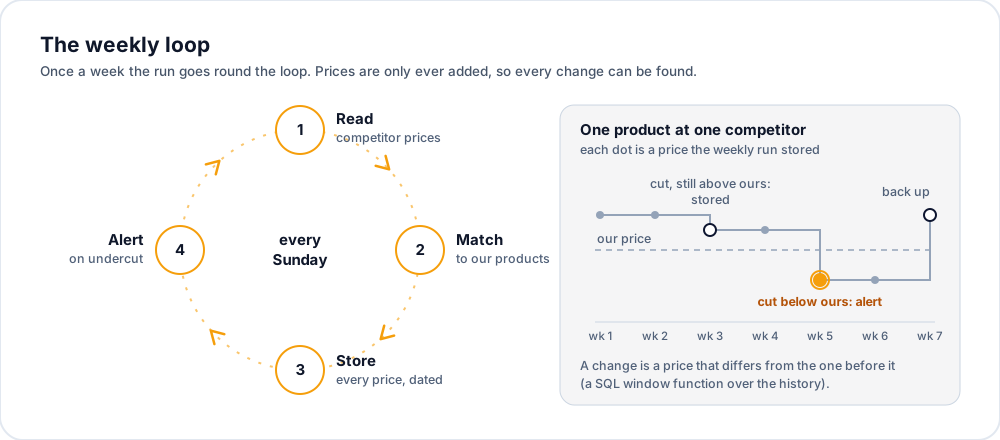
The weekly loop: every Sunday the run reads competitor prices, matches them to our products, stores every price with its date and sends an alert on an undercut; one product's history shows a cut that stays above our price, then a cut below it that raises the alert.
Read, match, store, alert, every week.
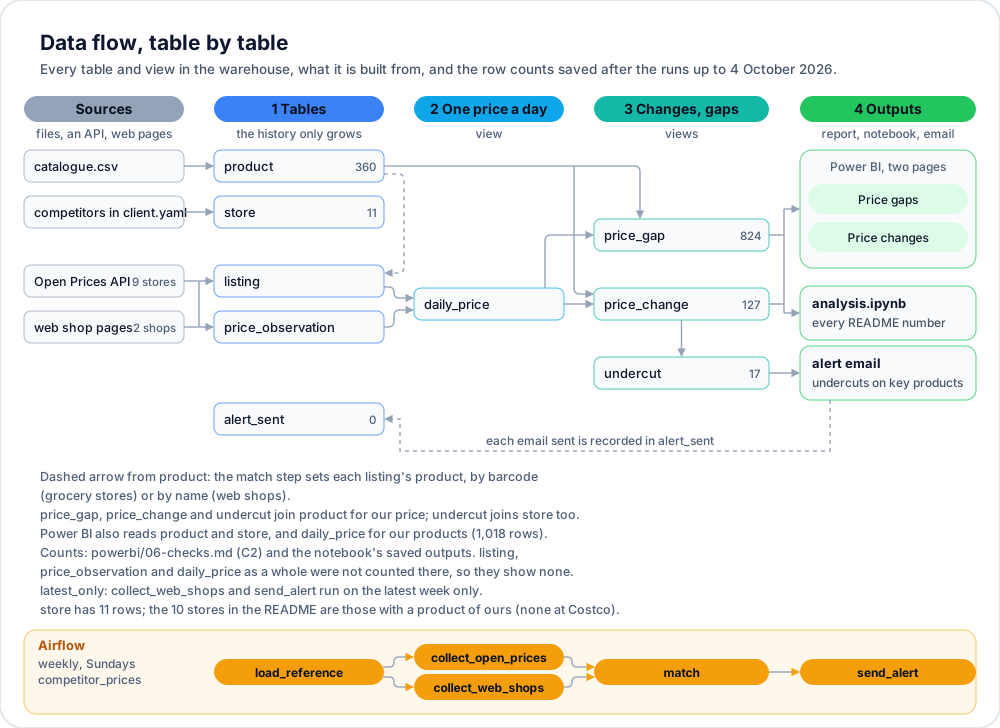
Data flow diagram: our 360-product catalogue and prices from 9 stores and 2 web shops flow into warehouse tables and views of 824 price gaps, 127 price changes and 17 undercuts, feeding two Power BI pages, the notebook and the alert email.
Every table and view, with its row count.
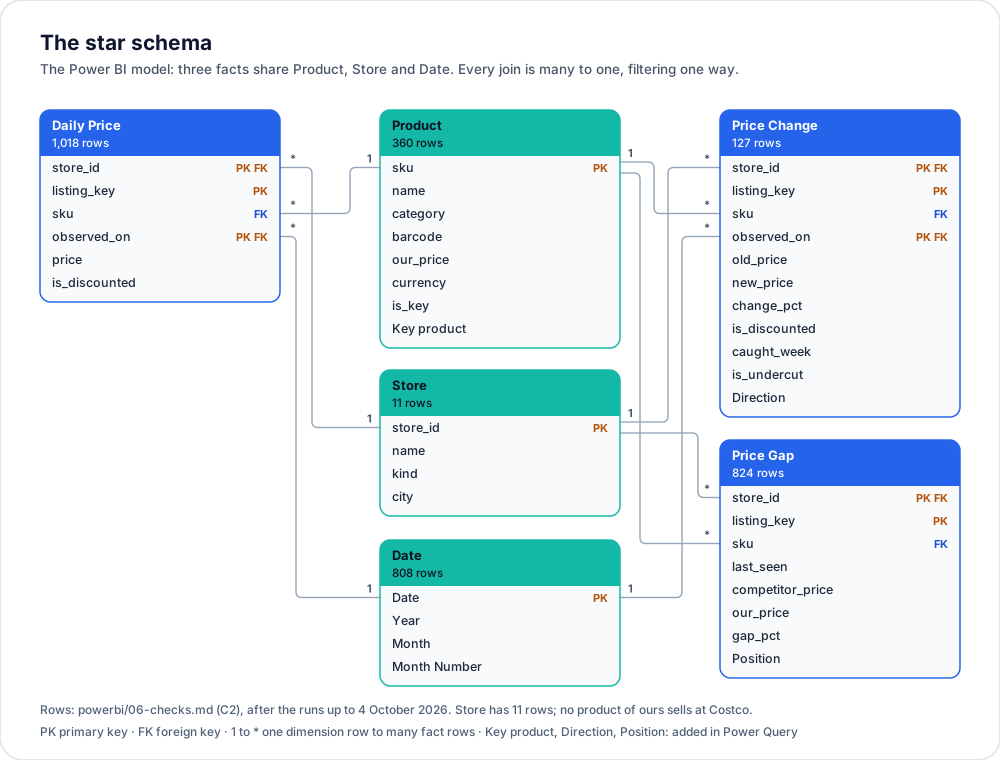
Star schema of the Power BI model: three fact tables of 1,018 daily prices, 824 price gaps and 127 price changes share 360 products, 11 stores and 808 dates.
Three facts, three shared dimensions.
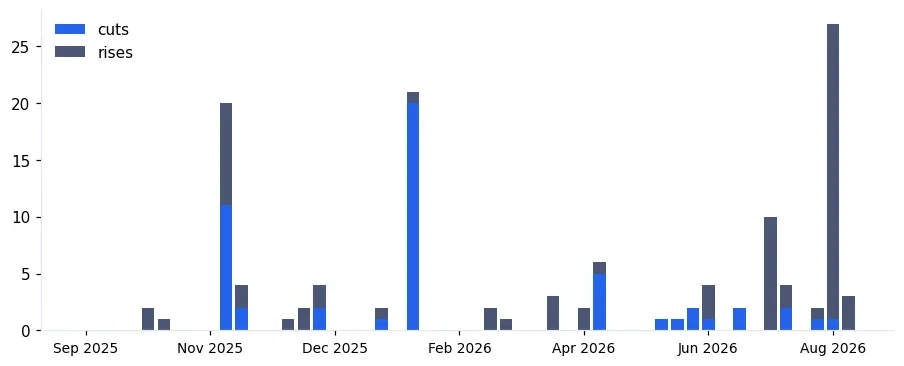
Chart: price changes caught by each weekly run from September 2025 to October 2026, 127 in all, 52 cuts and 75 rises, with the biggest runs at 20, 21 and 27 changes.
Cuts and rises caught by each run.

The code

for attempt in range(8):
    response = http.get(url, params=params or None, timeout=60)
    if response.status_code not in (429, 503):
        break
    wait = response.headers.get("Retry-After", "")
    time.sleep(int(wait) if wait.isdigit() else 2 ** attempt)
response.raise_for_status()
return response
tracker.py

The impact

  • Competitor prices checked automatically, with no one browsing.
  • An alert the week a key product is undercut.
  • Price history, so promotions and patterns show up.

The result

356 products across 10 stores: 127 price changes caught, each within one run.

Built with

  • Python
  • BeautifulSoup
  • Airflow
  • PostgreSQL
  • Power BI

Project · Power BI report fix

Rebuilding a slow sales report without changing a single number

The problem

The sales report takes ages to open, some totals look wrong, and people go back to Excel because they stopped trusting it.

The solution

The slow report's flat model rebuilt as a star schema with a date table, its slow DAX rewritten, and every number checked against SQL before and after, handed over with a build guide and a note of every change.

How it works

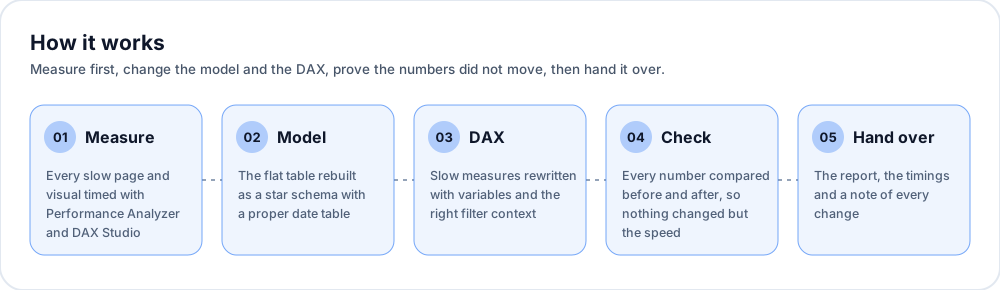
  • Measure: One timing method for every page, before and after: Performance Analyzer and DAX Studio from a cold cache
  • Model: The flat table rebuilt as a star schema with a proper date table
  • DAX: Slow measures rewritten with variables and filter context done right
  • Check: Every card, chart and table checked against SQL, the same in both reports
  • Hand over: Both reports, a step-by-step build guide and a note of every change

A closer look

How it works in five steps: time every slow page and visual, rebuild the flat table as a star schema, rewrite the slow measures with variables, compare every number before and after, and hand over the report with the timings.
Measure, rebuild, check, hand over.
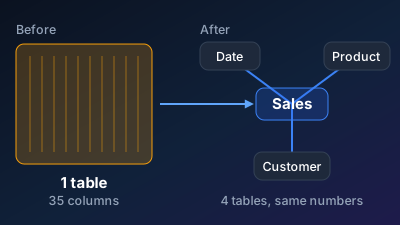
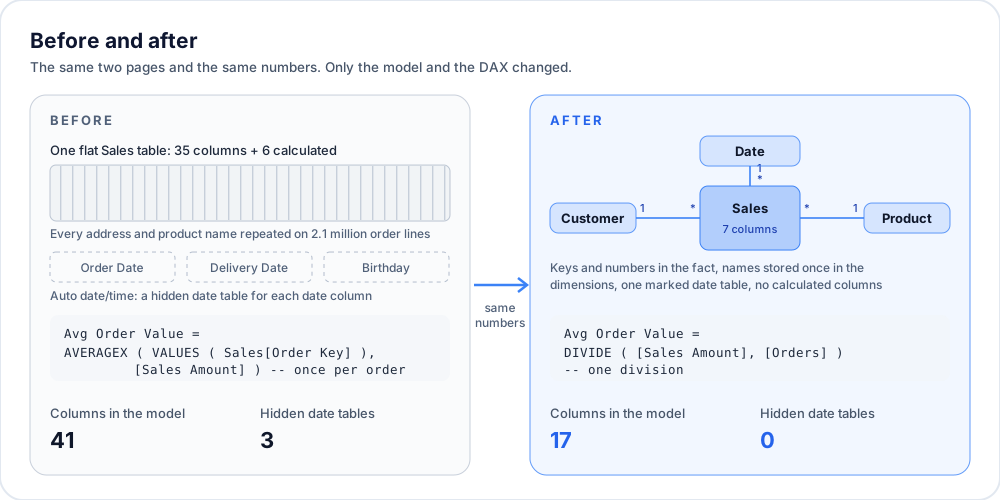
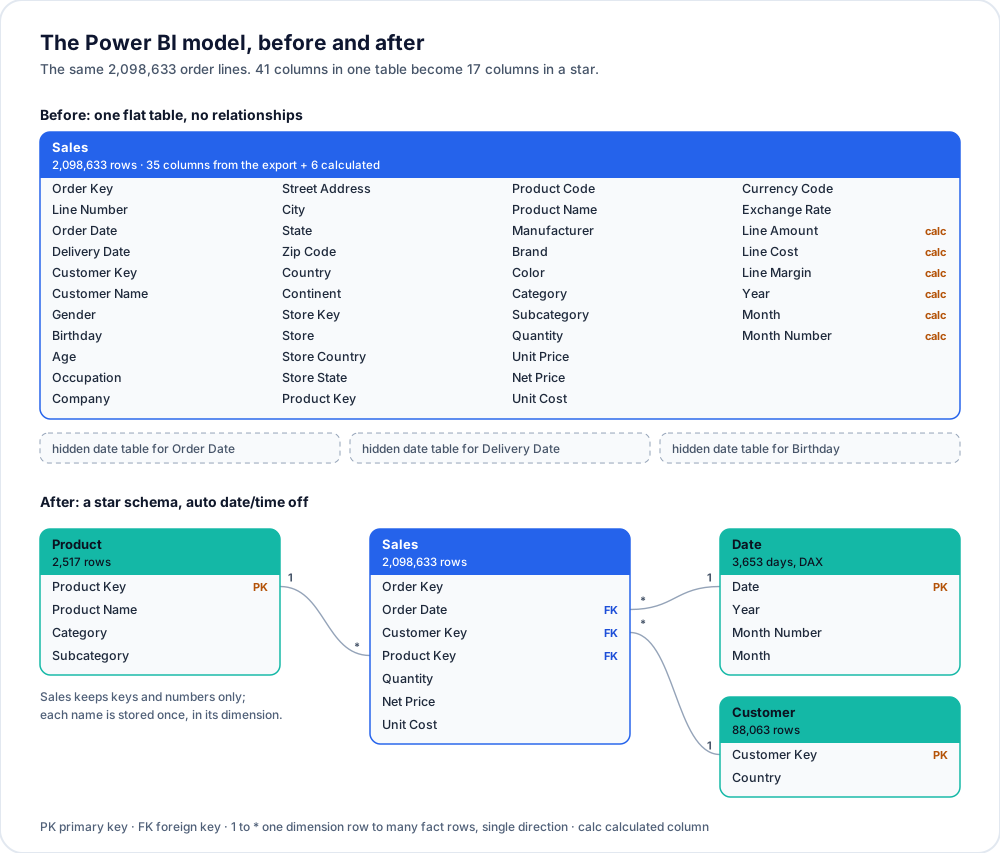
Before and after: one flat sales table with calculated columns and hidden date tables, rebuilt as a star schema with date, customer and product dimensions and simpler DAX, with the same numbers.
The model before and after the rebuild.
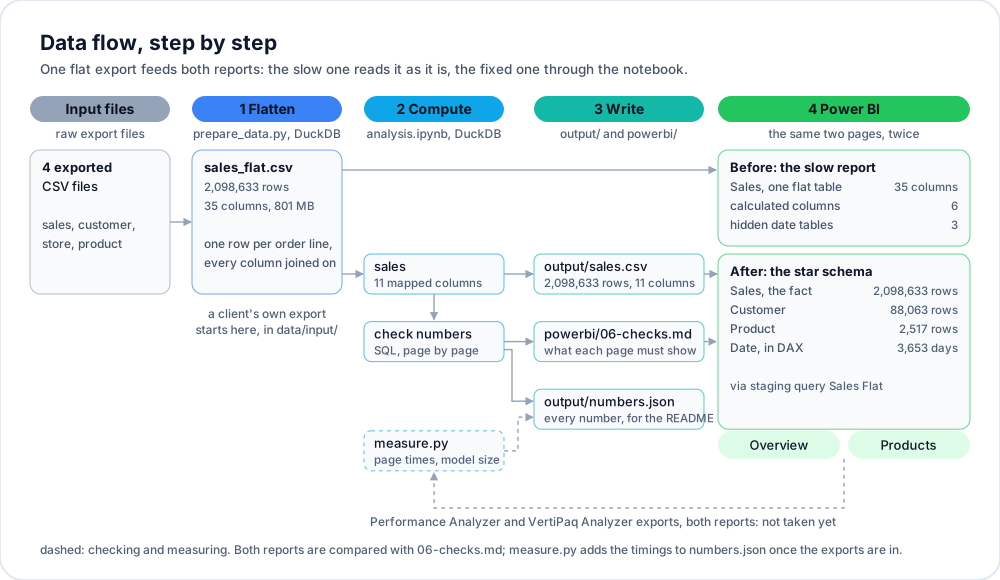
Data flow diagram: four exported CSV files are joined into one flat table of 2,098,633 order lines and 35 columns; the slow report reads it as it is, and the notebook writes an 11-column sales file and the check numbers for the rebuilt star of 88,063 customers, 2,517 products and 3,653 dates.
Both reports, from the same export.
The Power BI model before and after: 2,098,633 order lines in one flat table of 41 columns, rebuilt as a star of 17 columns with 88,063 customers, 2,517 products and 3,653 dates.
41 columns in one table become 17 in a star.

The code

overview = q('''
SELECT count(*)                       AS sales_rows,
       count(DISTINCT order_key)      AS orders,
       count(DISTINCT customer_key)   AS customers,
       count(DISTINCT product_key)    AS products,
       min(order_date)                AS first_order,
       max(order_date)                AS last_order,
       round(sum(quantity * net_price)) AS sales_all_years
FROM sales
''')
analysis/analysis.ipynb

The impact

  • A lean model: each name stored once, no hidden date tables, no calculated columns.
  • Totals that add up, checked against the source.
  • A model the next developer can understand.

The result

2,098,633 sales rows: one 35-column table rebuilt as a star schema of 4 tables, every number matched against SQL before and after.

Built with

  • Power BI
  • DAX
  • Power Query
  • DAX Studio
  • Python
  • SQL

Project · Sales performance dashboard

Showing which sellers and states deliver late, and what it costs in reviews

The problem

Orders, items, sellers and reviews sit in separate exports, so a marketplace cannot see on one page whether it is growing, who carries the revenue, or what late deliveries cost in customer reviews.

The solution

A Power BI report on a star schema with five pages, from overview to delivery: growth against last year, what sells, the sellers behind the revenue, late deliveries by seller and state, and security so each regional manager sees only their own sellers.

How it works

  • Load: Orders, items, products, sellers, customers and reviews checked and read by one Python notebook
  • Clean: Delivered orders only, the latest review of each order, English category names
  • Model: A star schema: one fact table of items sold, four dimensions, one-way filters
  • Measure: 23 DAX measures: growth against last year, late deliveries, reviews, seller share
  • Report: Five pages from overview to delivery, with each regional manager limited to their own sellers

A closer look

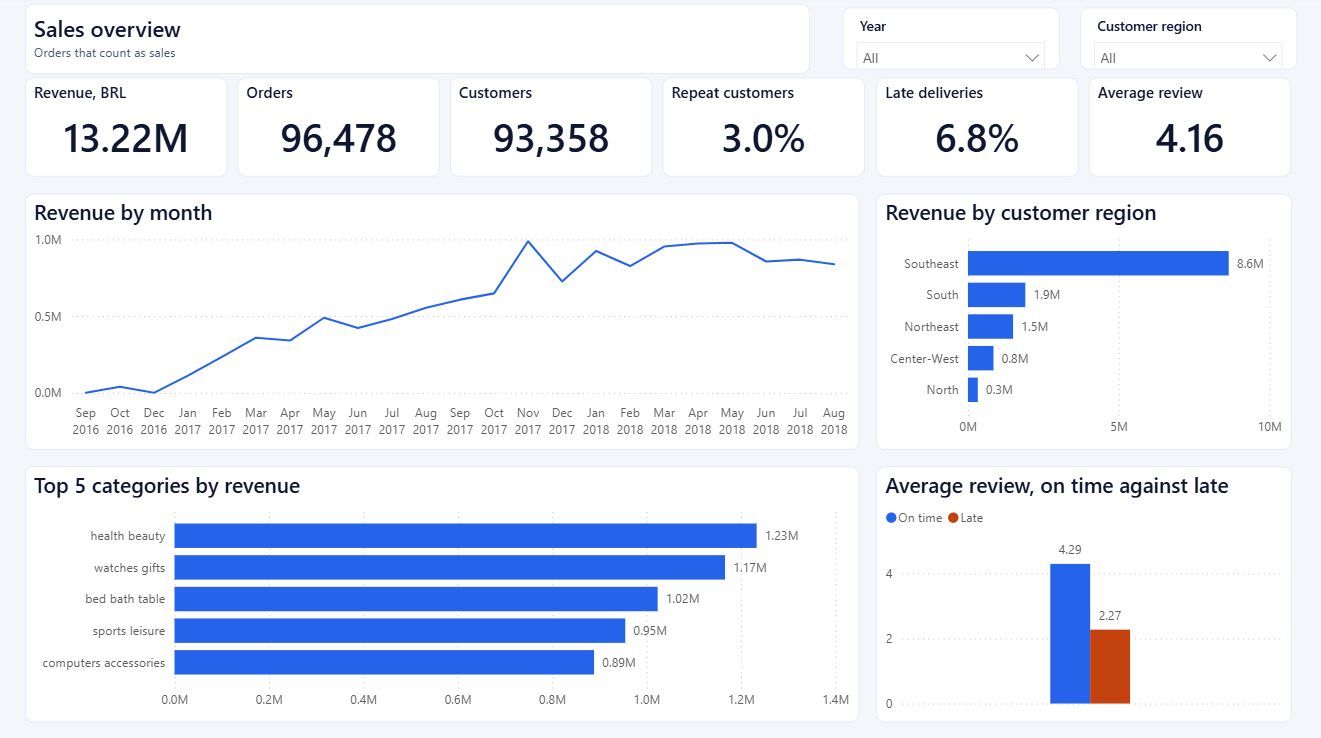
Power BI sales overview page: revenue, orders, customers, repeat customers, late deliveries and average review, with revenue by month, by region and by category.
Sales overview.
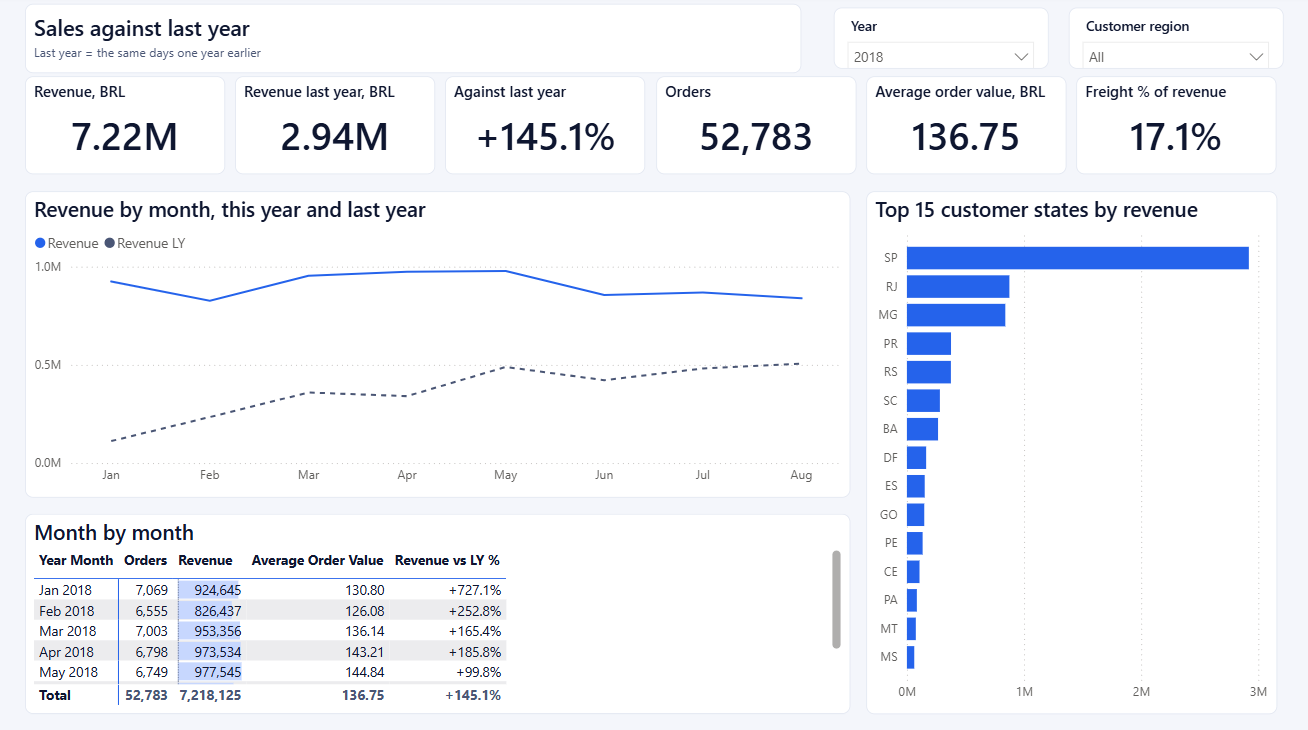
Power BI page comparing sales with the same days a year earlier, month by month, with the top customer states.
Sales against last year.
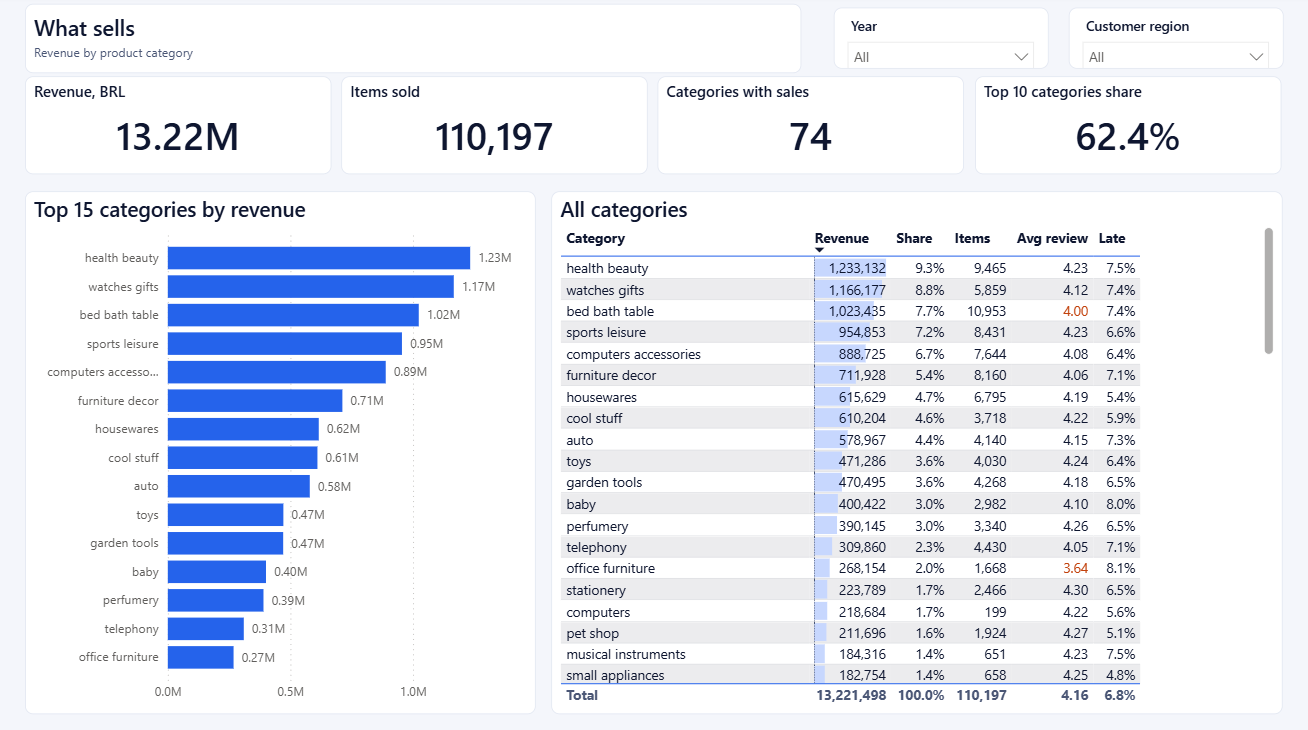
Power BI page of revenue by product category, with each category's share, items sold, average review and late rate.
What sells.
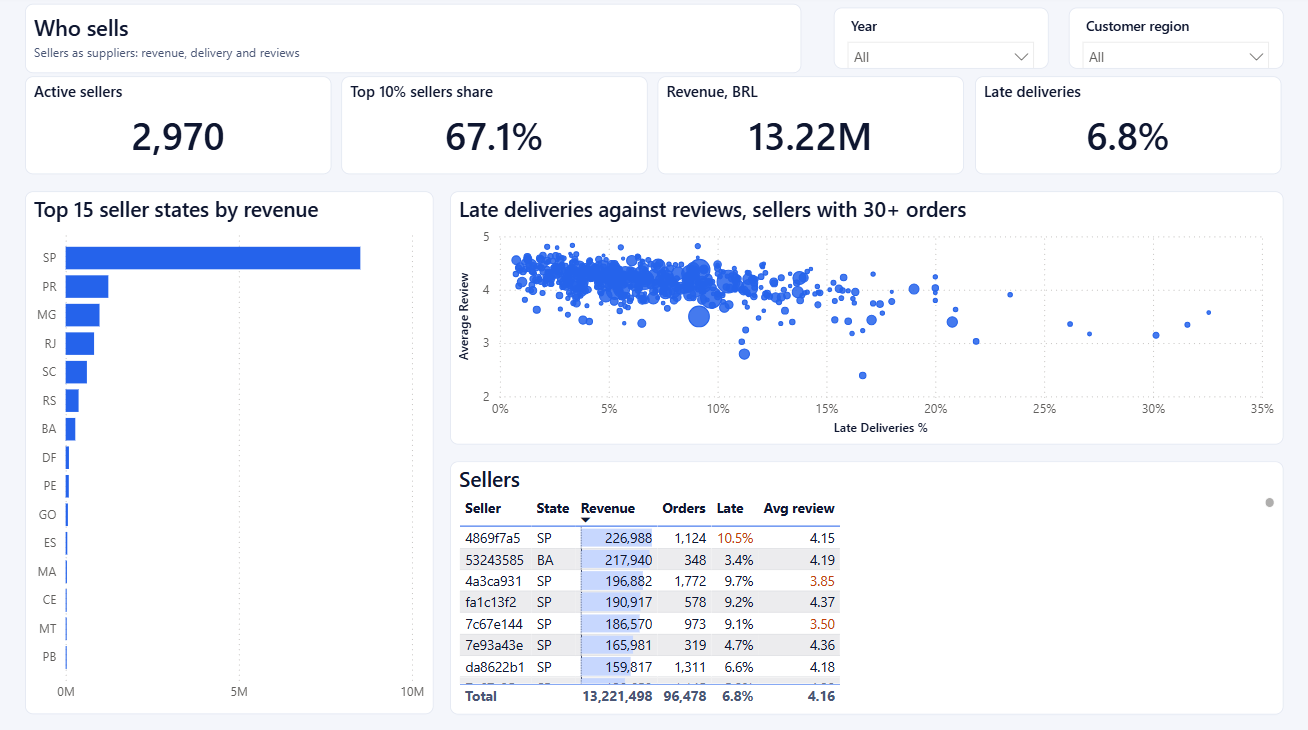
Power BI page of sellers: revenue by seller state, late deliveries against reviews for each seller, and a seller table.
Who sells.
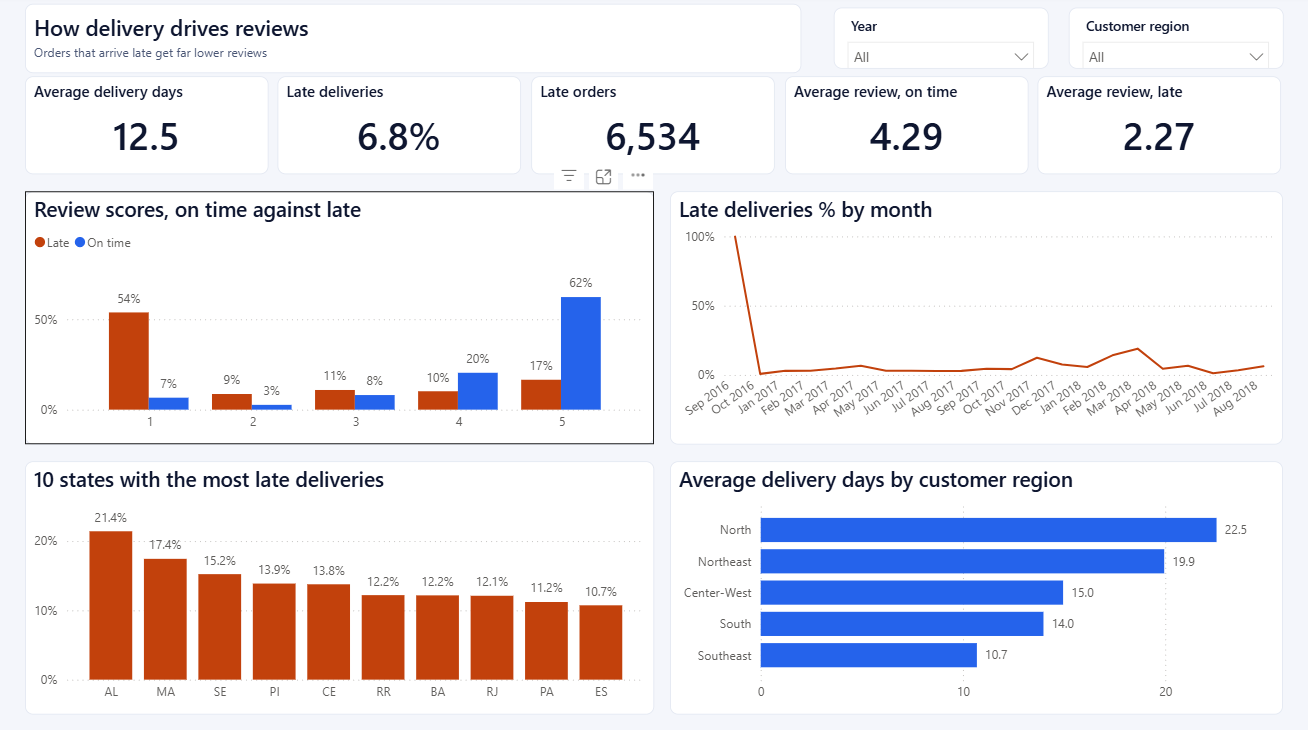
Power BI page on how delivery drives reviews: review scores for late and on-time orders, the late rate by month and by state, and delivery time by region.
How delivery drives reviews.
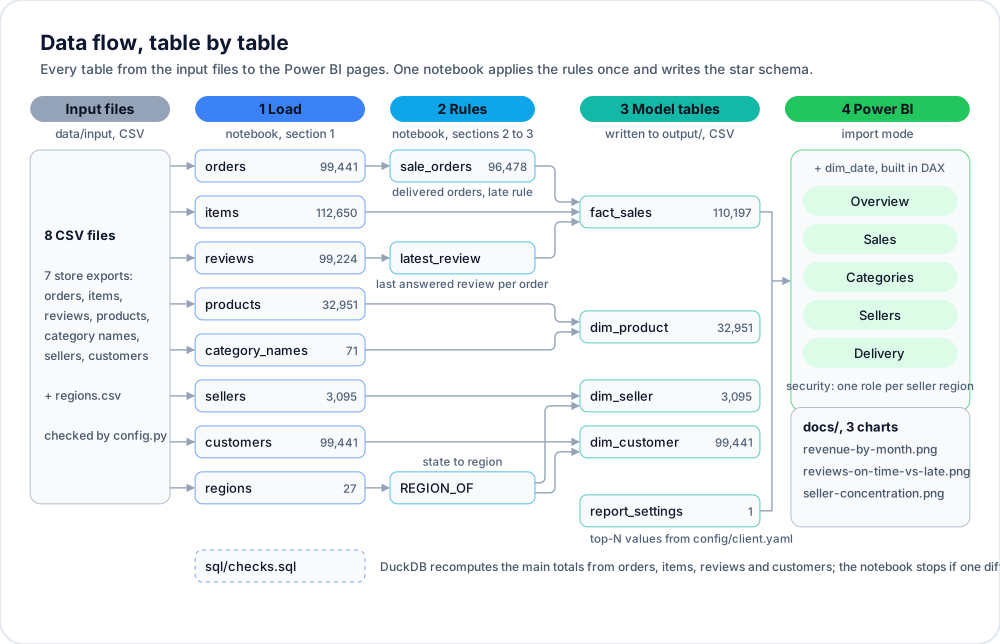
Data flow diagram: eight input files with 99,441 orders and 112,650 items pass through one notebook's rules into a star schema of 110,197 sales rows, 32,951 products, 3,095 sellers and 99,441 customers, which feeds five Power BI pages.
Every table, with its row count.
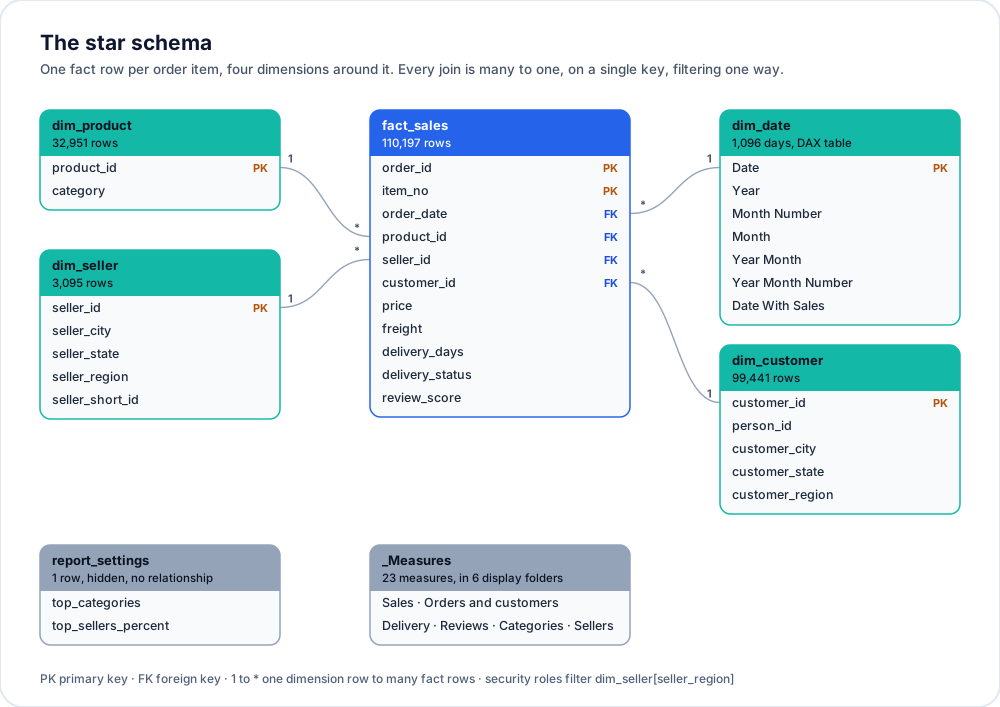
Star schema: one fact table of 110,197 order items joined to 32,951 products, 3,095 sellers, 99,441 customers and 1,096 dates, with 23 measures.
One fact table, four dimensions.

The code

WITH sale_orders AS (
    SELECT
        order_id,
        customer_id,
        CAST(purchased_at AS DATE) AS order_date,
        CAST(delivered_at AS DATE) AS delivered_date,
        CAST(estimated_at AS DATE) AS estimated_date
    FROM orders
    WHERE list_contains($sale_statuses, status)
),
sql/checks.sql

The impact

  • Growth against the same period last year on one page: 2018 revenue up 145%.
  • Late deliveries traced to sellers and states: 6.8% of orders overall, 21.4% in the worst state.
  • The 297 sellers who bring two thirds of the revenue, listed with their delivery and review record.
  • Each regional manager sees only the sellers in their region.

The result

96,478 orders: late orders scored 2.27 stars against 4.29 on time, and the top 10% of sellers brought 67% of revenue.

Built with

  • Power BI
  • DAX
  • Python
  • Star schema
  • Row-level security

Project · Delta lakehouseStay tuned

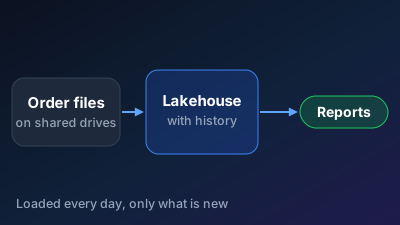
Daily order files loaded into a lakehouse, with every file kept

The problem

Order files pile up on shared drives, with no single source of truth and no history.

The solution

An Airflow pipeline picks up each new daily file from a storage container, PySpark builds raw, cleaned and reporting Delta tables, and Power BI reads the reporting layer.

How it works

  • Land: Daily order files dropped into a storage container (the Azure Blob Storage API)
  • Ingest: An Airflow task picks up only the files not loaded yet
  • Clean: PySpark jobs build raw, cleaned and reporting Delta tables
  • Load: Merges keep one current row per item; the raw layer keeps every file as received
  • Report: Power BI on the reporting layer

Built with

  • PySpark
  • Delta Lake
  • Airflow
  • Azurite
  • Docker
  • Power BI

Project · Supplier invoice checkStay tuned

Catching supplier overbilling before it is paid

The problem

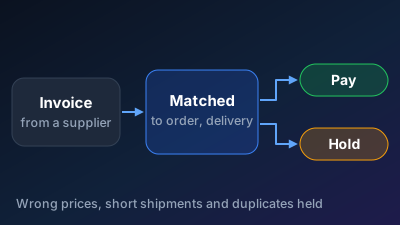
Accounts payable pays supplier invoices that don't match the purchase order or the delivery: wrong prices, short shipments and duplicates, because nobody checks every line by hand.

The solution

A pipeline that reads each invoice PDF or scan, matches it line by line to its purchase order and goods receipt, and flags every mismatch before payment, with a report per supplier and department.

How it works

  • Read: Invoice PDFs and scans read with Docling and a local vision model
  • Extract: Lines, prices and quantities into a checked invoice schema
  • Match: Each line matched to its purchase order and goods receipt, within tolerances
  • Flag: Mismatches and duplicates held aside with the reason
  • Report: Power BI overbilling report per supplier and department

Built with

  • Python
  • Docling
  • Ollama
  • PostgreSQL
  • dbt
  • Airflow
  • Power BI

Project · Ask your warehouseStay tuned

Answering managers' data questions in seconds

The problem

Managers wait days for an analyst to pull a simple number, and analysts spend their week on repeat requests.

The solution

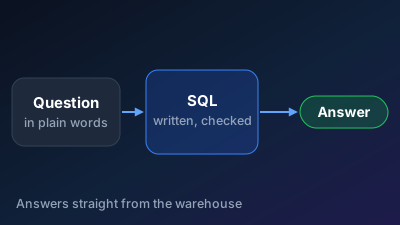
An assistant that turns a plain question, such as late deliveries by supplier last month, into a checked, read-only SQL query on the warehouse, and refuses rather than guesses.

How it works

  • Model: Orders loaded as a documented star schema
  • Ask: A manager types a question in plain language
  • Plan: A LangGraph agent picks the tables and writes SQL from the dbt docs
  • Check: The read-only query is validated before it runs
  • Answer: The result with its query shown, or a clear refusal

Built with

  • LangGraph
  • Ollama
  • PostgreSQL
  • dbt
  • FastAPI
  • DeepEval

Project · Contract assistantStay tuned

Finding the penalty clause before the supplier does

The problem

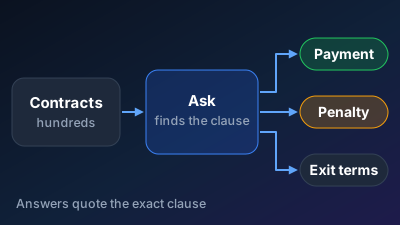
Payment terms, penalties and termination clauses are buried in hundreds of supplier contracts, and buyers miss them.

The solution

An assistant that answers questions about supplier contracts in plain language and cites the exact clause, tested against labelled contracts.

How it works

  • Parse: Docling splits contracts into sections and clauses
  • Index: Clauses embedded locally and stored in Qdrant
  • Retrieve: Hybrid search with BM25 and a cross-encoder reranker
  • Answer: A local LLM answers with the clause cited
  • Evaluate: RAGAS and DeepEval scores on the labelled clauses

Built with

  • RAG
  • Docling
  • Qdrant
  • FastAPI
  • Ollama
  • RAGAS

Project · Supply-chain martsStay tuned

Supply-chain KPIs every analyst can trust

The problem

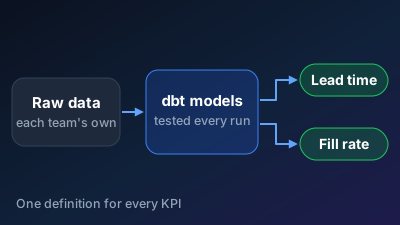
Every team calculates lead time and fill rate differently, so the same question gets different answers.

The solution

dbt marts that define lead time, fill rate and supplier cost once, tested on every run and documented with lineage anyone can browse.

How it works

  • Generate: Suppliers, parts and orders loaded with DuckDB
  • Stage: dbt staging models clean and rename the sources
  • Model: Marts for lead time, fill rate and supplier cost
  • Test: Built-in and custom dbt tests on every run
  • Publish: dbt docs and lineage published with GitHub Actions

Built with

  • dbt
  • DuckDB
  • Jinja
  • dbt-utils
  • GitHub Actions

Project · Master-data governanceStay tuned

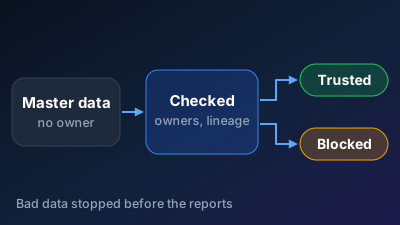
Catching bad supplier data before it reaches reports

The problem

Supplier and product master data has no owner, no lineage and no checks, so errors surface in the reports.

The solution

A governance layer with quality checks on every load, owners and definitions in a data catalogue, lineage from source to dashboard, and access set by role.

How it works

  • Profile: Supplier and product tables profiled in PostgreSQL and MongoDB
  • Check: Soda Core quality checks on every load
  • Catalogue: OpenMetadata holds owners, definitions and tags
  • Trace: Lineage from source to dbt models to dashboard
  • Secure: Roles limit access to sensitive fields

Built with

  • OpenMetadata
  • Soda Core
  • PostgreSQL
  • MongoDB
  • dbt

Project · Department demand at scaleStay tuned

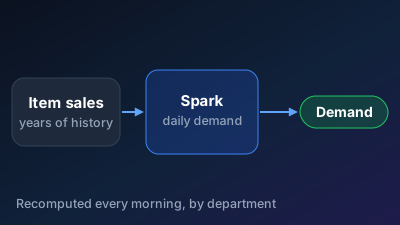
Daily demand from years of sales, recomputed every morning

The problem

Demand planning runs on slow spreadsheets that can't hold years of item-level sales.

The solution

Spark jobs that reshape and aggregate years of item, store and department sales into Parquet, tuned with partitioning and caching, ready for planning reports.

How it works

  • Load: Store sales, calendar and prices into HDFS
  • Reshape: PySpark unpivots daily sales per item and store
  • Aggregate: Spark SQL demand per department, store and week
  • Tune: Partitioning, caching and file sizes tuned and measured
  • Store: Results written as Parquet for reporting

Built with

  • Apache Spark
  • PySpark
  • Spark SQL
  • Hadoop
  • Parquet

Project · Real-time stock alertsStay tuned

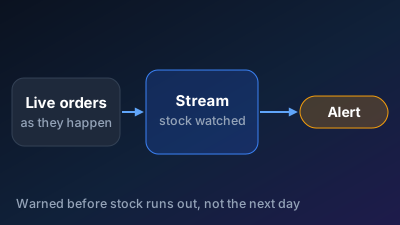
Warning before stock runs out

The problem

Stock-outs show up in yesterday's report, after the sales are already lost.

The solution

Orders stream in live, stock per department is recalculated continuously, and an alert fires the moment an item drops below its threshold, alongside live review sentiment per supplier.

How it works

  • Stream: Orders and reviews streamed into Kafka topics
  • Process: Spark Structured Streaming updates stock per item and department
  • Score: A BERT model scores review sentiment per supplier
  • Alert: A threshold breach triggers an alert
  • Store: Events and totals land in PostgreSQL for reporting

Built with

  • Kafka
  • Spark Streaming
  • PostgreSQL
  • Airflow
  • Docker

Project · Self-healing ingestionStay tuned

Keeping supplier feeds loading when their files change

The problem

Nightly loads break when a supplier renames a column or changes a unit, and reports go stale until someone fixes the code.

The solution

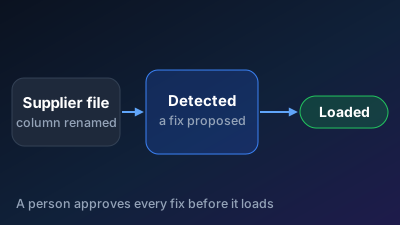
An Airflow pipeline that detects schema changes in each supplier feed, proposes a fix with an LLM agent, tests it, and loads the data once a person approves.

How it works

  • Receive: One CSV feed per supplier lands on schedule
  • Detect: Schema and value checks compare each file with its contract
  • Propose: An LLM agent drafts the mapping fix
  • Approve: A person approves the fix through a pull request
  • Load: The corrected feed loads into PostgreSQL

Built with

  • Airflow
  • Python
  • PostgreSQL
  • LangGraph
  • Ollama
  • Langfuse

Project · Catalog SKU matchingStay tuned

One clean product record per item, across every supplier

The problem

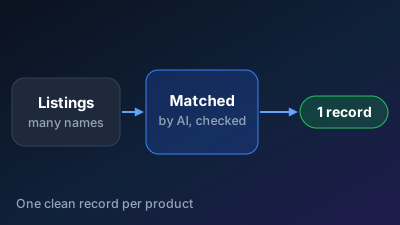
The same product is listed by several suppliers under different names, with missing attributes, so stock and sales split across duplicates.

The solution

A pipeline that extracts attributes from supplier titles, descriptions and images, matches listings of the same product with embeddings, and keeps one clean record per item.

How it works

  • Collect: Supplier titles, descriptions and images loaded per feed
  • Extract: A local LLM fills a checked attribute schema
  • Embed: Listings embedded and stored in pgvector
  • Match: The same product matched across suppliers, uncertain pairs reviewed
  • Publish: One product record per item in the warehouse

Built with

  • Python
  • Ollama
  • Pydantic
  • sentence-transformers
  • pgvector
  • dbt

Project · Warehouse MCP serverStay tuned

Letting any AI assistant read the warehouse safely

The problem

Teams want AI assistants on their data, but giving a model database access is risky.

The solution

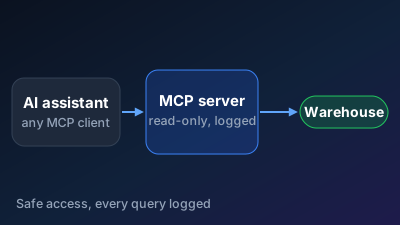
An MCP server that exposes the warehouse through read-only, documented tools, so any MCP client can answer questions from the data within set limits.

How it works

  • Describe: The dbt manifest and docs describe every table
  • Expose: The MCP server offers read-only query and lookup tools
  • Limit: Row limits, timeouts and allowed schemas enforced
  • Log: Every call logged with its query
  • Connect: Tested with MCP Inspector and a desktop client

Built with

  • Python
  • MCP
  • PostgreSQL
  • dbt
  • Docker

Project · Customer-service agentStay tuned

Taking order-status questions off the support team

The problem

E-commerce support teams drown in order-status, return and refund messages.

The solution

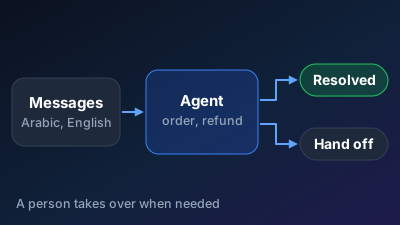
A support agent that understands the request, looks up the real order, starts returns, and hands angry or complex cases to a person with the full conversation.

How it works

  • Understand: A local LLM sorts each message by intent and mood, as structured output
  • Look up: Agent tools query the real order in PostgreSQL
  • Act: Starts a return or answers the delivery question
  • Hand off: Complex or angry cases go to a person with the transcript
  • Monitor: A Streamlit view of intents, resolutions and hand-offs

Built with

  • Ollama
  • LangGraph
  • FastAPI
  • PostgreSQL
  • Streamlit

Project · Review intelligenceStay tuned

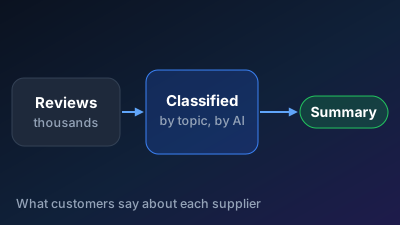
What customer reviews say about each supplier

The problem

Quality problems hide in thousands of reviews that nobody has time to read.

The solution

A pipeline that classifies reviews by topic and sentiment, summarises them per supplier and product, and shows the results in a dashboard.

How it works

  • Collect: Product reviews loaded from the marketplace
  • Classify: A local LLM labels topic and sentiment as structured output
  • Summarise: LLM summaries of complaints per supplier and product
  • Check: Labels compared with a hand-labelled sample
  • Report: A Gradio dashboard per supplier

Built with

  • Ollama
  • Pydantic
  • Python
  • Gradio
  • DeepEval

Project · Arabic product searchStay tuned

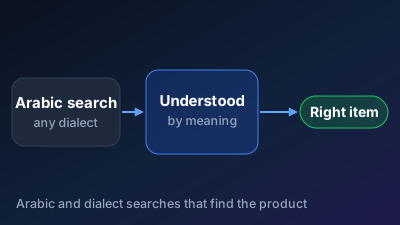
Arabic shoppers finding products on the first search

The problem

Arabic and dialect searches return nothing on most stores, and the sale is lost.

The solution

Product search and questions in Arabic and English, matching queries to products with multilingual embeddings and answering product questions from the listings.

How it works

  • Normalise: CAMeL Tools cleans Arabic spelling and diacritics
  • Embed: bge-m3 multilingual embeddings for queries and products
  • Search: Qdrant returns the closest products
  • Answer: A local LLM answers product questions from the listing
  • Evaluate: Hit rate on the translated test queries

Built with

  • CAMeL Tools
  • bge-m3
  • Qdrant
  • Ollama
  • Gradio

Project · Supplier risk agentStay tuned

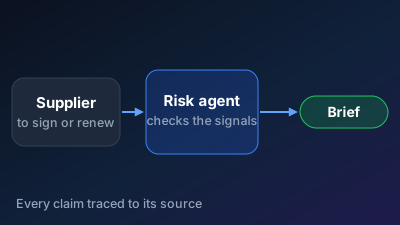
A supplier risk brief in minutes

The problem

Buyers sign or renew suppliers without checking news, financial and delivery risk signals.

The solution

A research agent that searches the web and the supplier master, gathers risk signals, and writes a short brief with sources for a buyer to review.

How it works

  • Plan: A LangGraph agent plans the research steps
  • Search: Web search and the supplier master through MCP tools
  • Gather: Risk signals stored with their sources in Chroma
  • Write: The brief written with citations
  • Review: A buyer approves or edits the brief

Built with

  • LangGraph
  • Ollama
  • MCP
  • FastAPI
  • Chroma
  • Langfuse

Project · LLM gatewayStay tuned

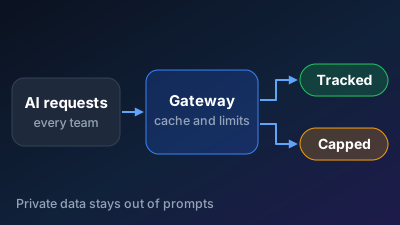
AI cost per department, visible and capped

The problem

AI bills grow with no owner and no limits, and private data can leak into prompts.

The solution

A self-hosted gateway in front of every model that tracks cost per department, caps spending, caches repeat questions and removes personal data before it reaches a model.

How it works

  • Route: LiteLLM routes each request to the right model
  • Protect: Presidio removes personal data from prompts
  • Cache: Redis caches repeat questions
  • Limit: Budgets and rate limits per department
  • Trace: Langfuse records cost and response time

Built with

  • LiteLLM
  • vLLM
  • Redis
  • Presidio
  • Langfuse
  • FastAPI

Project · Egyptian Arabic modelStay tuned

A small model that understands Egyptian shoppers

The problem

Generic models misread Egyptian dialect messages, so bots send the wrong answer.

The solution

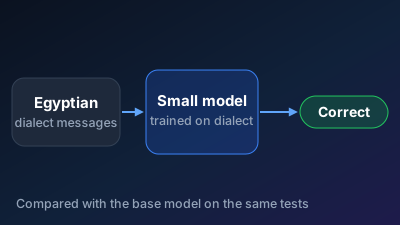
A small open model fine-tuned with QLoRA on Egyptian Arabic shopper messages, quantised to run locally, and compared with the base model on the same test set.

How it works

  • Prepare: Support messages translated into Egyptian Arabic and checked by hand
  • Train: QLoRA fine-tuning with Unsloth on a free GPU
  • Quantise: Exported to GGUF for local use
  • Serve: Runs in Ollama
  • Compare: Accuracy against the base model, tracked in MLflow

Built with

  • Unsloth
  • Transformers
  • PEFT
  • QLoRA
  • Ollama
  • MLflow

Project · Delivery voice agentStay tuned

Delivery calls handled without a call centre

The problem

Customers and drivers call to ask when and where an order will arrive, and the phone never stops.


The solution

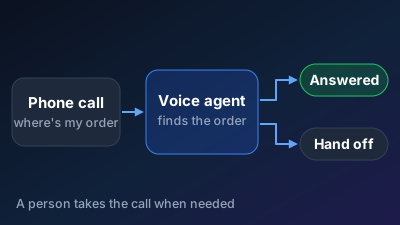
A voice agent that answers delivery calls, looks up the order and its expected date, and passes anything unusual to a person.

How it works

  • Listen: faster-whisper turns speech into text
  • Understand: A local LLM with tool calling finds the intent
  • Look up: The order and delivery dates from PostgreSQL
  • Reply: Piper speaks the answer back
  • Hand off: Unusual calls passed to a person

Built with

  • Pipecat
  • faster-whisper
  • Ollama
  • Piper
  • FastAPI
  • PostgreSQL

Project · Egypt real estate price tracker

Our asking price per m² against 5,619 competing listings, every week

The problem

A developer or brokerage selling units in Egypt's growth areas checks competing listings by hand now and then, so nobody can say how its asking price per m² compares with the units around it, or who cut their price.

The solution

A weekly pipeline reads the asking prices on the main listing sites, checks every row, keeps each price with its week, and compares our units with the same type in the same area, by compound and developer, in Power BI.

How it works

  • Collect: Asking prices for units for sale read every week from the listing sites, area by area
  • Check: Every row needs a price, a size, an area and a type; a row that fails is set aside with its reason
  • Store: Every asking price kept with its week and never overwritten, so a price cut can be shown
  • Compare: Each of our units against the competing listings of the same type in the same area, by compound and developer
  • Report: Power BI pages of the gap by area, compound and developer, and of who cut prices

A closer look

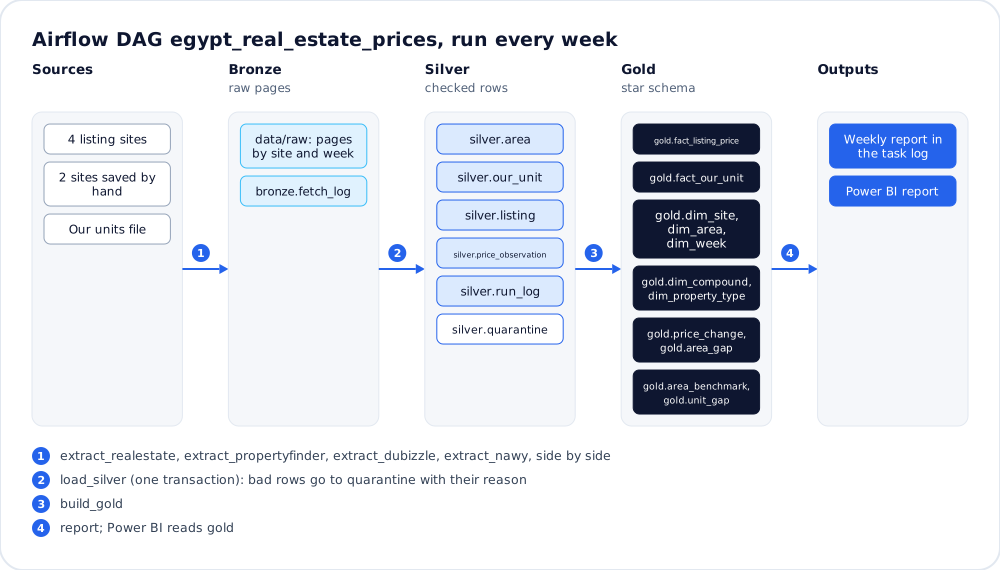
Pipeline diagram: four listing sites read by Airflow, two sites saved by hand and our units file flow through bronze, silver and gold tables to a weekly report and a Power BI report.
The weekly pipeline, from the listing sites to the report.
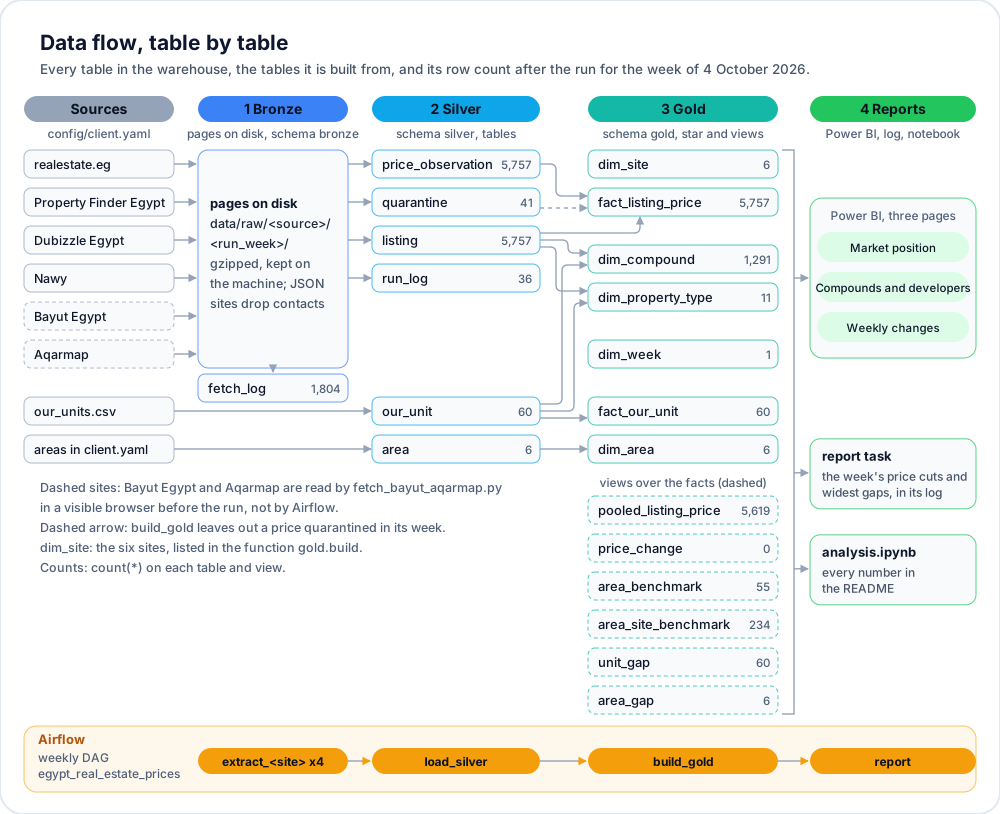
Data flow diagram: six listing sites and our 60 units flow through bronze, silver and gold tables; one week gives 5,757 listings, 41 quarantined rows and 1,291 compounds, ending in three Power BI pages and a weekly report.
Every table, with its row count for one week.
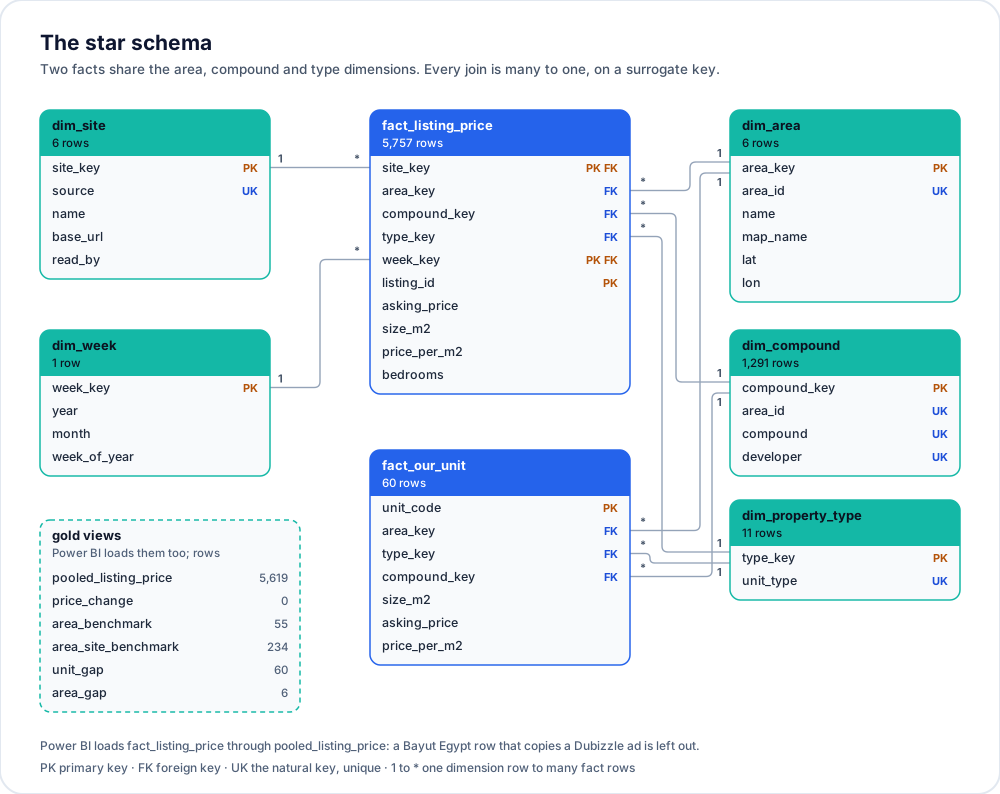
Star schema: two fact tables, 5,757 listing prices and our 60 units, share 6 areas, 1,291 compounds and 11 property types, with 6 sites and one week on the listing side.
Two facts on shared dimensions.
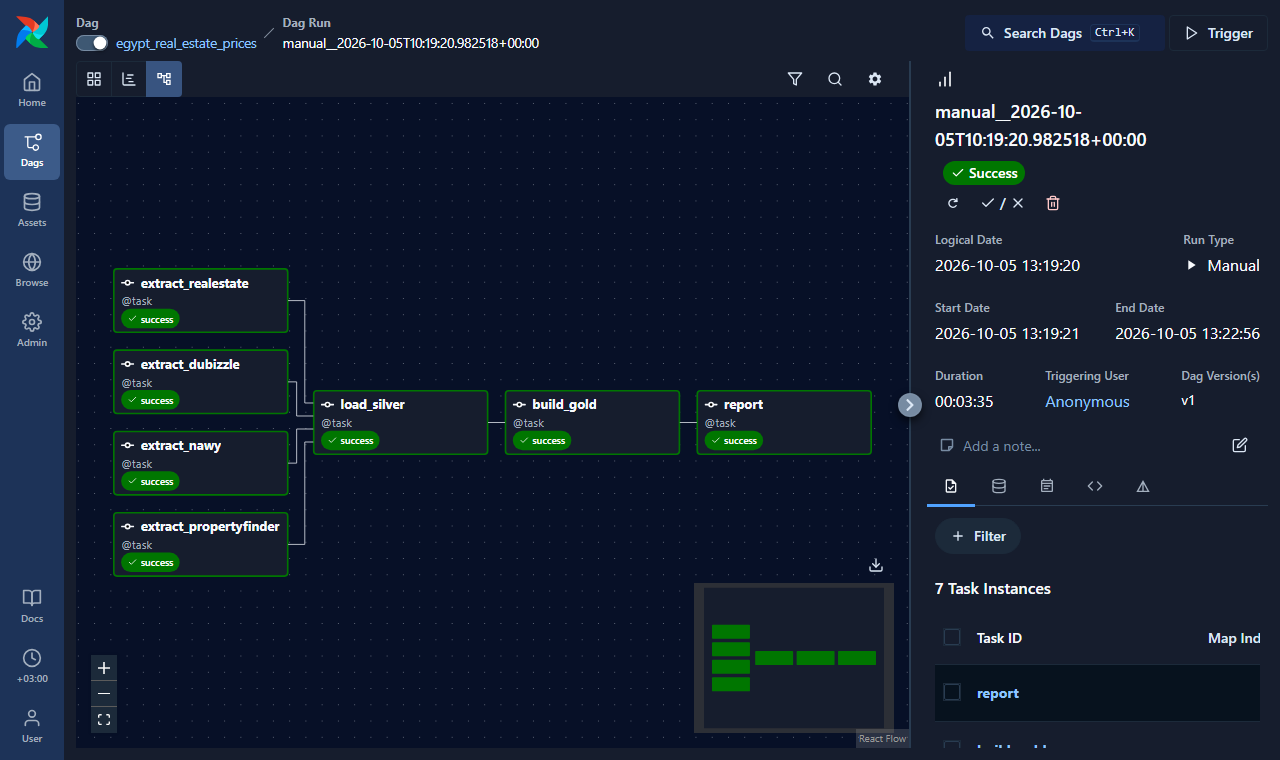
Airflow graph view of a successful run: one extract task per site side by side, then load_silver, build_gold and report.
The Airflow DAG, run every week.
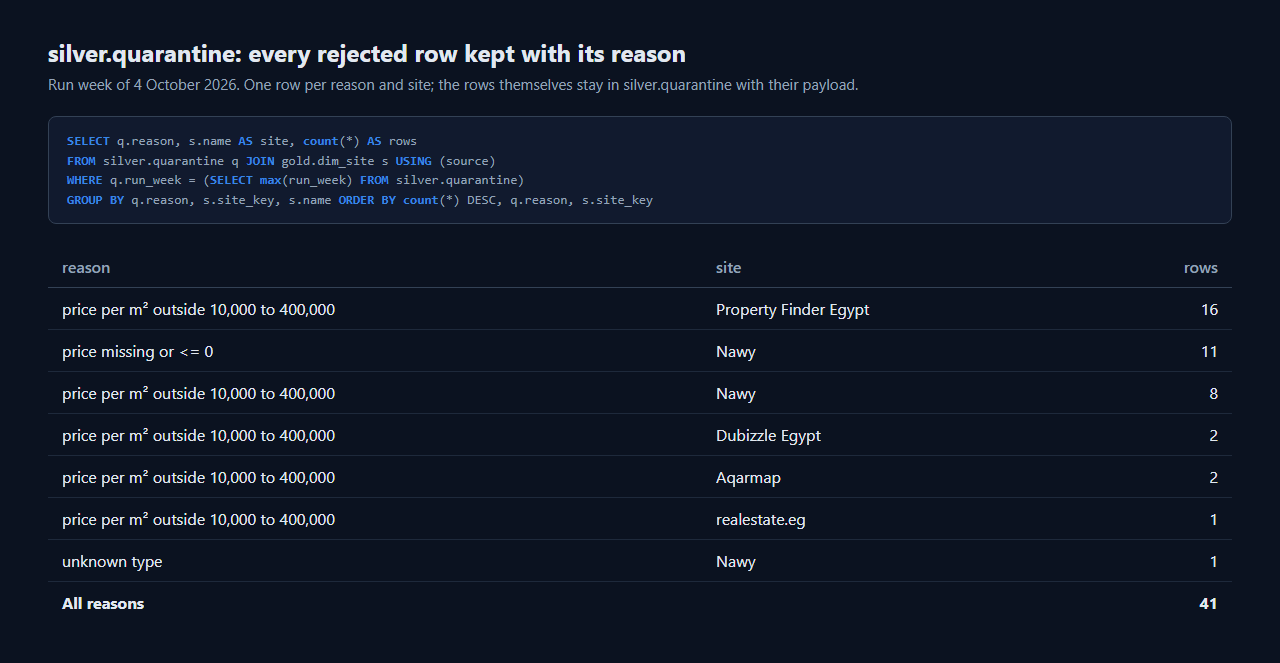
Query on silver.quarantine: the rejected rows of one run week counted by reason and site, such as a price per square metre outside the allowed band.
Rows that fail a check are kept with their reason, never dropped.
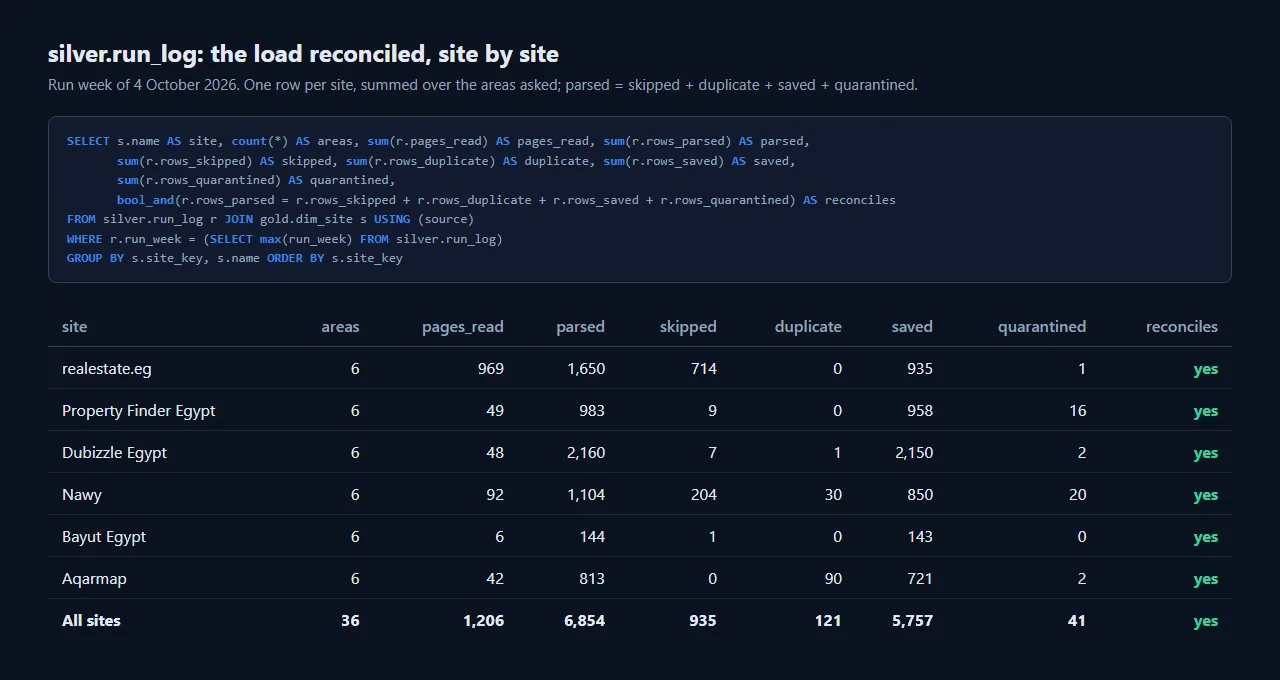
Run log query for the week of 4 October 2026: six sites read 1,206 pages and parsed 6,854 rows, of which 935 were skipped, 121 were duplicates, 5,757 were saved and 41 were quarantined, and every site reconciles.
Every parsed row is accounted for, site by site.
The code

"source": source,
"source_listing_id": str(listing_id),
"url": url,
"area_id": area_id,
"compound": " ".join(compound.split()) if compound else None,
"developer": " ".join(developer.split()) if developer else None,
"unit_type": unit_type(label),
"bedrooms": integer(bedrooms),
"bathrooms": integer(bathrooms),
"size_m2": decimal(size),
"asking_price": decimal(price),
"listed_on": listed_on,
sites.py

The impact

  • Our asking price per m² set against the market every week, area by area.
  • The areas and units where we ask most above the median of their type.
  • Every price kept with its week, so a competitor's cut shows up the week it happens.
  • Rows that fail a check set aside with their reason, never dropped.

The result

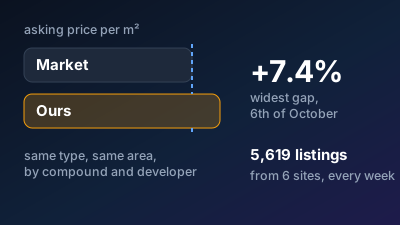
5,619 competing listings from 6 sites in 6 areas read and checked, 1,152 compound names and 307 developers covered; our units' widest gap is +7.4% in 6th of October, and 41 rows (0.7%) were set aside with their reason.

Built with

  • Python
  • Airflow
  • PostgreSQL
  • Playwright
  • Docker
  • Power BI

Project · Egypt spare parts price tracker

Seeing where every spare part is cheaper, across 13 Egyptian sellers, every week

The problem

An Egyptian spare-parts retailer sells the same belts, filters and spark plugs as a dozen online shops whose prices move every week, so nobody can say which competitor is cheaper on which part until the customer has bought elsewhere.

The solution

A weekly pipeline reads the prices of 13 online sellers, checks every row, keeps each price with its date, finds the same part at each seller by its part number, and emails when a competitor goes below our price, with the gaps in Power BI.

How it works

  • Collect: Prices read every week from the sites of 13 Egyptian spare-parts sellers
  • Check: Every row checked before it is stored; a bad row is set aside with its reason, never lost
  • Store: Every price kept with its date in a warehouse, so changes become history
  • Match: The same part found across sellers by its part number
  • Report: An email when a competitor cuts a price below ours, and Power BI pages of the gaps

A closer look

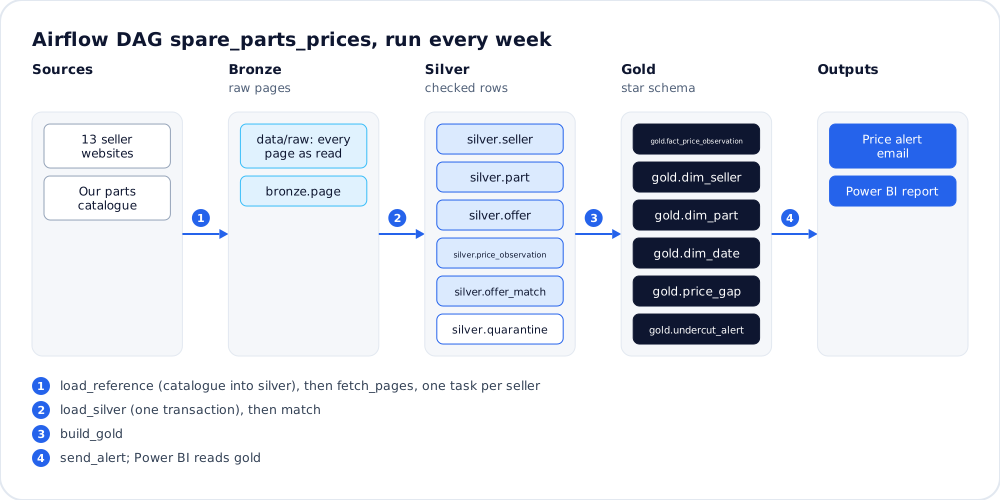
Pipeline diagram: the seller websites and our parts catalogue flow through bronze, silver and gold tables, ending in a price alert email and a Power BI report.
The weekly pipeline, with the real task and table names.
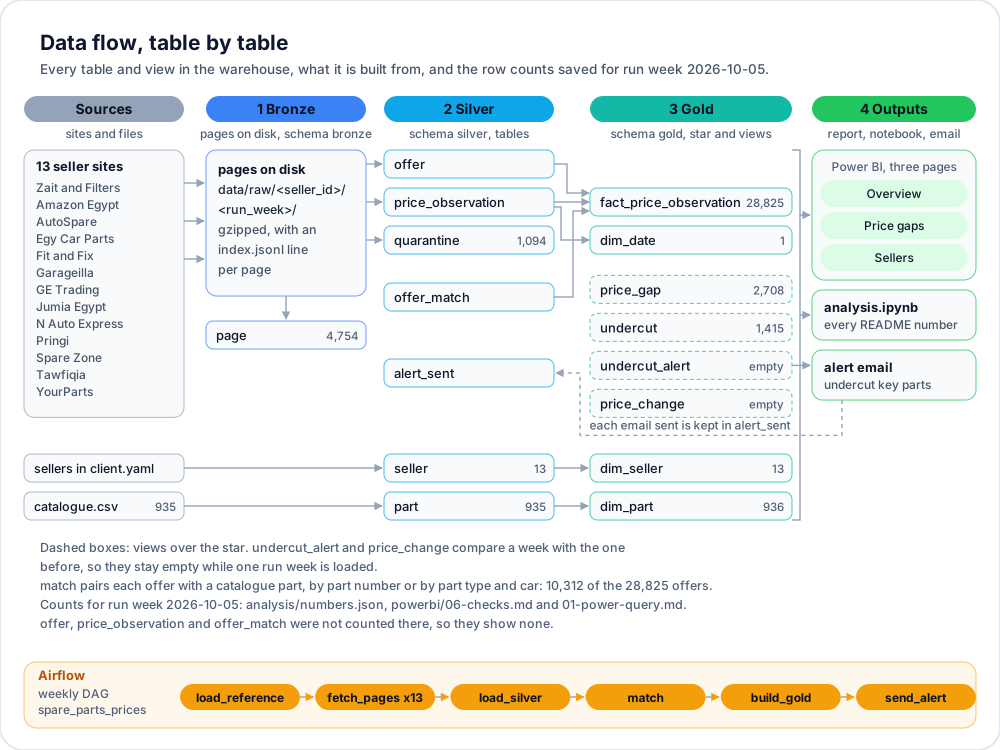
Data flow diagram: 13 seller sites and our 935-part catalogue flow through bronze, silver and gold tables; one run week gives 28,825 offers, 10,312 of them matched to our parts, 2,708 price gaps and 1,415 undercuts.
Every table and view, with its row count.
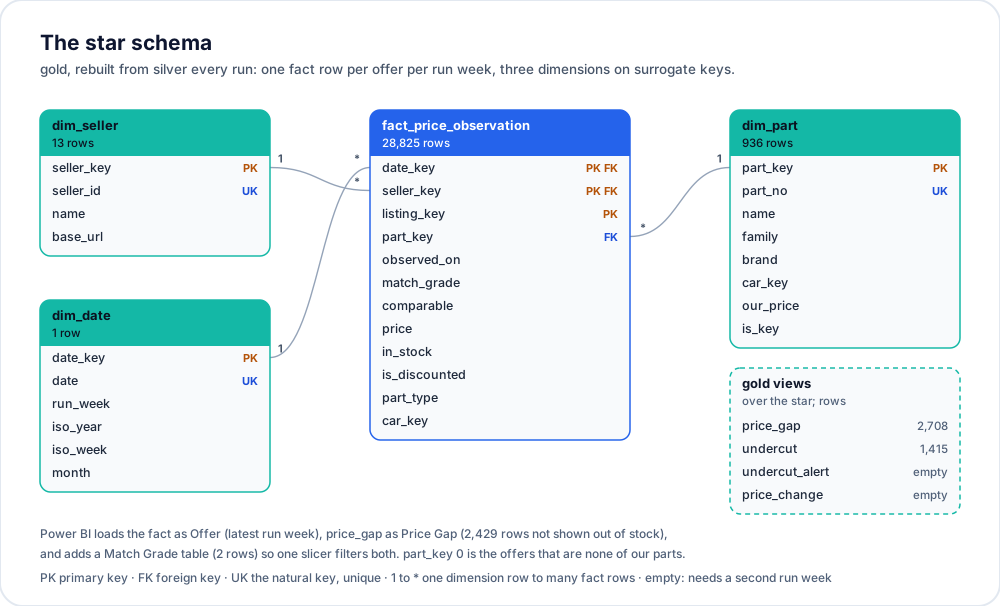
Star schema: one fact table of 28,825 offers for one run week, joined to 13 sellers, 936 parts and one date.
One fact table, three dimensions.
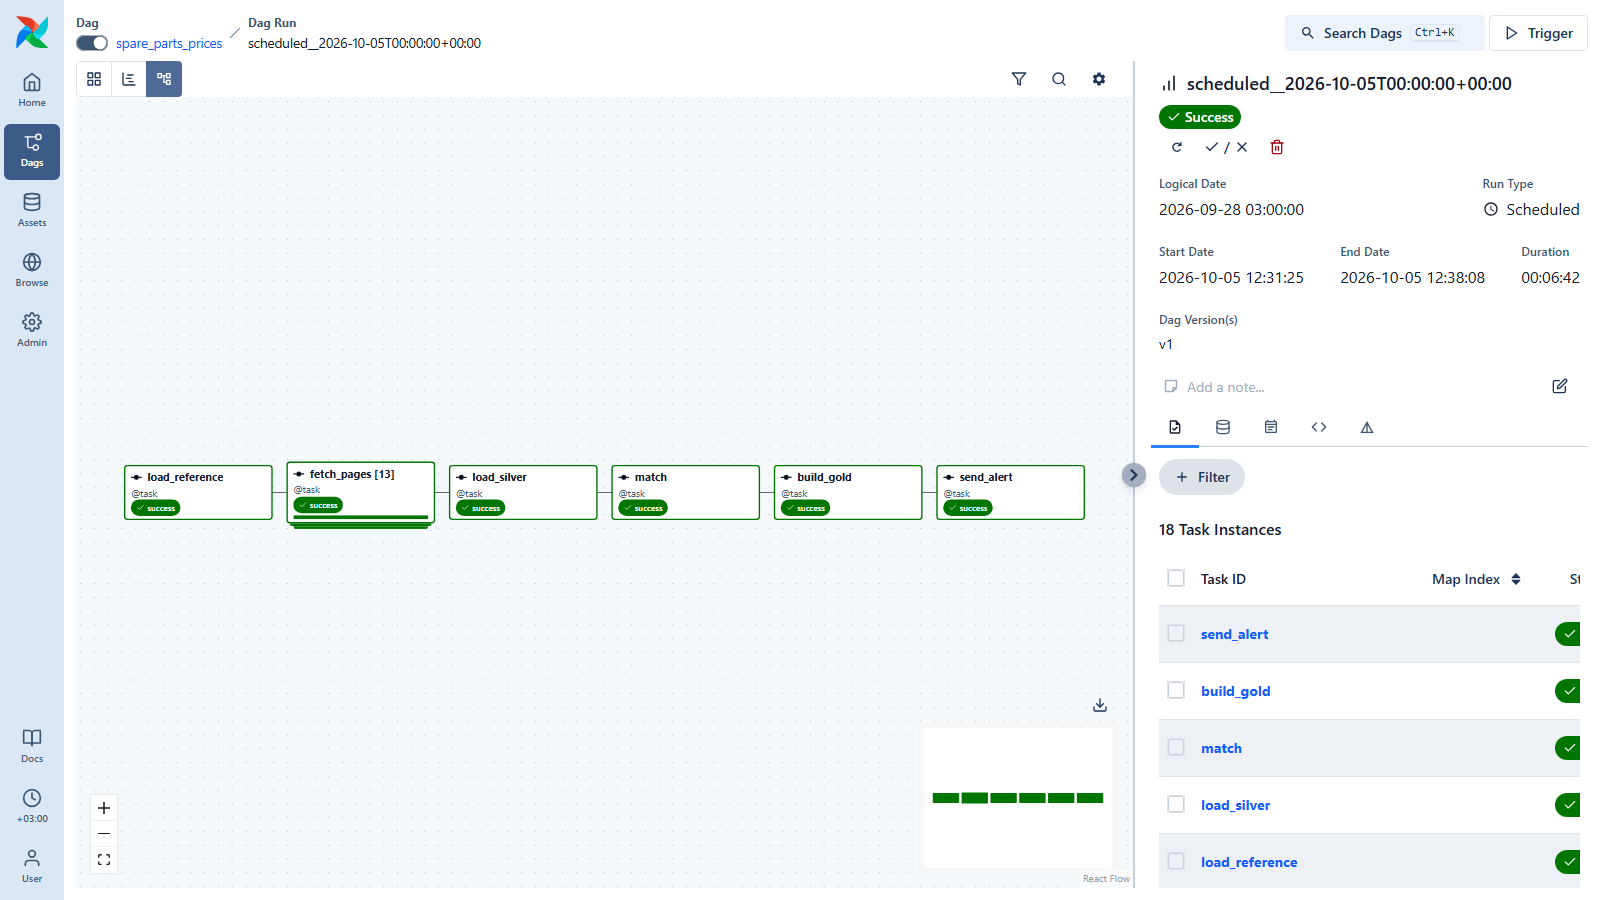
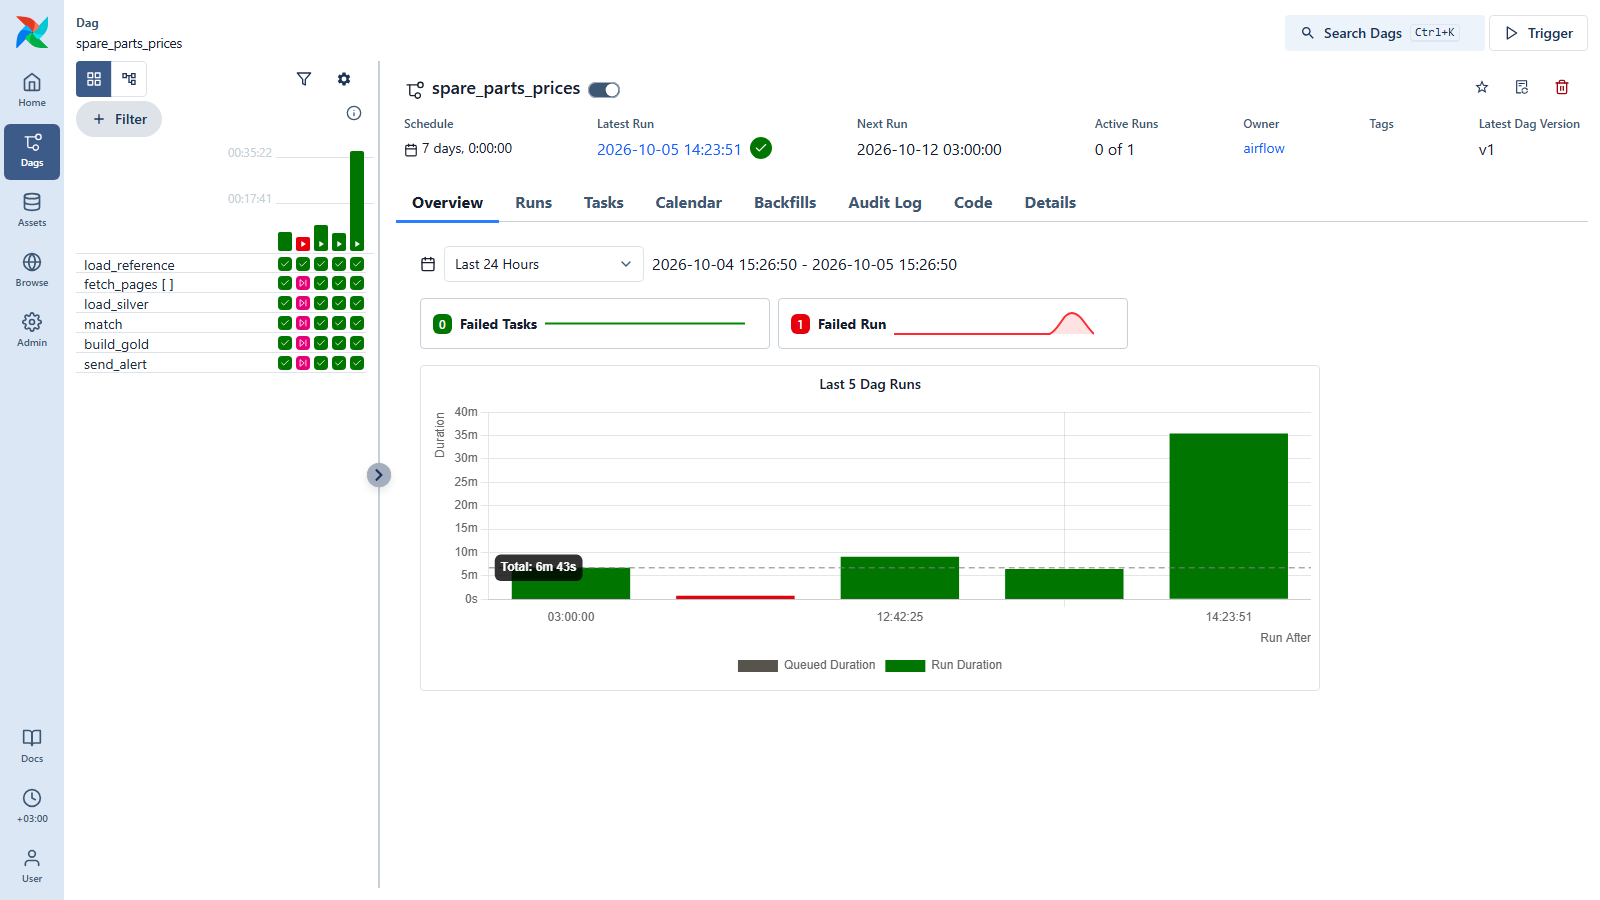
Airflow graph view of a successful weekly run: load_reference, fetch_pages for 13 sellers, load_silver, match, build_gold and send_alert.
The Airflow DAG, run every week.
Airflow grid view of the last five runs, task by task, with each run's length.
Run history in Airflow, task by task.

The code

offers.append({
    "listing_key": str(p["id"]),
    "title": p["title"],
    "price": price,
    "currency": "EGP",
    "is_discounted": bool(price and was and was > price),
    "url": f"{base}/products/{quote(p['handle'])}",
    "brand": (p.get("vendor") or "").strip() or None,
    "part_no": scrape.part_code(variant.get("sku")),
    "in_stock": variant.get("available"),
})
scrapers/nautoexpress.py

The impact

  • Every competitor price read each week, with no one browsing.
  • The parts where a competitor sells below us, seller by seller.
  • Every price kept with its date, so a one-week promotion stands apart from a new normal.
  • Rows that fail a check set aside with their reason, never dropped.

The result

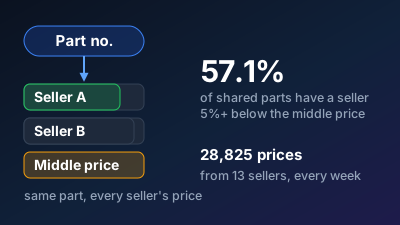
28,825 prices from 13 sellers in one weekly run: 88 of the 154 parts sold under the same part number (57.1%) have a seller at least 5% below the market's middle price.

Built with

  • Python
  • Web scraping
  • Airflow
  • PostgreSQL
  • Power BI